It looks like you're using an Ad Blocker.
Please white-list or disable AboveTopSecret.com in your ad-blocking tool.
Thank you.
Some features of ATS will be disabled while you continue to use an ad-blocker.
share:
reply to post by rosswellian responding to BO
That will be really interesting. I was considering creating (have created in SQL) a 'swarmalyser' run that flags areas that look as if they are swarming, but I have so much to do it never got finished yet.
Without a doubt this addition to the tool will be great.
I am not usually particularly effusive about things but I have to say that the 3D viewer is without doubt the best thing that has become available in a long time and does as you say fill a big gap.
I'm going to add, in a couple of months, a "heat map" layer, which is so very, very cool. It is a "point density" map, meaning highly dense areas of quakes, no matter the magnitude, cause yellow, orange or even the rare but rewarding RED. Upon investigatiuon of red areas, it is usually a human-caused activity such as mining, or dense array experiments, but the occasional completely Natural earthquake swarm can be seen, such as the completely bizarre 2002 Manchester UK swarm that was confined to October and November.
That will be really interesting. I was considering creating (have created in SQL) a 'swarmalyser' run that flags areas that look as if they are swarming, but I have so much to do it never got finished yet.
Without a doubt this addition to the tool will be great.
I am not usually particularly effusive about things but I have to say that the 3D viewer is without doubt the best thing that has become available in a long time and does as you say fill a big gap.
reply to post by PuterMan
That's OK Puterman . . . as you know, I have more than enough
effusiveness
to do for both of us as well as for muzzy and many others besides.
LOL
I'll be happy to take care of the effusiveness end of things.
I'm pretty effusive about you two, as well. LOL.
That's OK Puterman . . . as you know, I have more than enough
effusiveness
to do for both of us as well as for muzzy and many others besides.
LOL
I'll be happy to take care of the effusiveness end of things.
I'm pretty effusive about you two, as well. LOL.
reply to post by rosswellian
This is good, and yes the IRIS Time series is another great tool recently introduced and which I have interfaced from my program for plots and will very be shortly be doing so for audio to supplement the audio facilities I already have.
Is that Tim or Rob? You want me to email them and tell them to back off? I would be very happy to email either or both of them and say that this is a VERY important tool, at least for the greater public and earthquake nerds although I am sure that the scientists find it useful as well. The tool is definitely unique enough to warrant a great deal of attention. In fact I am going to email both of them and make that point without mentioning this conversation. I shall also do a piece about the tool in my blog and email a few of my contacts to point them at the tool.
Unfortunately I doubt it as I am just a long in the tooth programmer that first used ANSI Basic 1.0 - yes that old!
That is the truth.
Indeed and the side to side rotation is fantastic.
I, and I am sure all those on this thread, will do everything I can to back your cause.
Understood, and I shall create a link for my program and let you know when that is done.
Aside from that the reason I wanted to know if it could be linked as a DLL was basically because the tool can only use Seismic Monitor data, or IRIS data. The quake nerds among us of which I am obviously one would find it very useful to point the 3D viewer at different datasets. If one of the parameters could receive for example a dropbox link to a csv or JSON file we could then plot Turkey and New Zealand and other areas that we regularly look at that do not have data in IRIS. As an example the El Hierro swarms would be good as would much of the Iceland data but there is insufficient data down to Mag 1 or less available. The image below show El Hierro from 2011 which should have a huge number of quakes but does not.

Click the image to enlarge
This is not a criticism of the tool, or of IRIS, just a statement of fact that all earthquake data is not in one place. Even selecting all earthquakes around the El Hierro area I only get 76 you can see from the list that this is not a lot of good for looking at current activity there.
This is the type of scenario where the facility to point a list at the IEB or 3D viewer would be good. The IEB is just Google Map, and I can output Google Maps. All it needs is the ability to link to CSV, or JSON or if it would be easier to KML.
Running out of steam I think so I will sign off there so as not to be boring.
My intention over the next week or two is to finish linking the Time Series audio and then to create a linking form (URL builder) for the IEB and or 3D viewer.
Stupendous tool Sir and one that should be promulgated around the world. I shall do my best. I might even do a stand alone 'URL Builder' for it (Windows only I am afraid).
PS the pop-up list and zoom to (see image above) is a nice feature as well.
there are many cool products available to programs or people. The parameters are quite consistent, as we are working with Europeans to realize a consistent set....
This is good, and yes the IRIS Time series is another great tool recently introduced and which I have interfaced from my program for plots and will very be shortly be doing so for audio to supplement the audio facilities I already have.
...and my boss has me jumping to move on to other stuff but in my heart I want to finish IEB (the google map) and 3DV (the companion 3D viewer), because so far they are unique enough to warrant attention and value.
Is that Tim or Rob? You want me to email them and tell them to back off? I would be very happy to email either or both of them and say that this is a VERY important tool, at least for the greater public and earthquake nerds although I am sure that the scientists find it useful as well. The tool is definitely unique enough to warrant a great deal of attention. In fact I am going to email both of them and make that point without mentioning this conversation. I shall also do a piece about the tool in my blog and email a few of my contacts to point them at the tool.
Now I'm guessing you will implement some cooler thing, haha, and I welcome it.
Unfortunately I doubt it as I am just a long in the tooth programmer that first used ANSI Basic 1.0 - yes that old!
The total lack of ability to visualize "earthquake sets" in profile, or pseudo-3D, so far is abominable.
That is the truth.
So much info can only be seen if you can look North, Up, or whatever angle, to see the patterns.
Indeed and the side to side rotation is fantastic.
I can help some, but as I said my boss has me off onto a new project, however as I go I collect feedback such as yours, to bolster my case that we/I should concentrate on these two tools, the map and the 3D viewer. I want to make it really useful but have to fight against real-world forces, as does my boss, of course... I hope to have time enough to be responsive over the next many months, if you can continue to make and share links into either IEB or 3DV, it assists me in my case, whereby I say that the number of hits we get is justification enough to continue and enhance it.
I, and I am sure all those on this thread, will do everything I can to back your cause.
....if you know start time, end time, min lat, max lat, etc (study the URL it is all in there) then you can programmatically (dynamically) construct links into either IEB (the map) or 3DV ( the viewer) rather easily....
Understood, and I shall create a link for my program and let you know when that is done.
Aside from that the reason I wanted to know if it could be linked as a DLL was basically because the tool can only use Seismic Monitor data, or IRIS data. The quake nerds among us of which I am obviously one would find it very useful to point the 3D viewer at different datasets. If one of the parameters could receive for example a dropbox link to a csv or JSON file we could then plot Turkey and New Zealand and other areas that we regularly look at that do not have data in IRIS. As an example the El Hierro swarms would be good as would much of the Iceland data but there is insufficient data down to Mag 1 or less available. The image below show El Hierro from 2011 which should have a huge number of quakes but does not.

Click the image to enlarge
This is not a criticism of the tool, or of IRIS, just a statement of fact that all earthquake data is not in one place. Even selecting all earthquakes around the El Hierro area I only get 76 you can see from the list that this is not a lot of good for looking at current activity there.
This is the type of scenario where the facility to point a list at the IEB or 3D viewer would be good. The IEB is just Google Map, and I can output Google Maps. All it needs is the ability to link to CSV, or JSON or if it would be easier to KML.
Running out of steam I think so I will sign off there so as not to be boring.
My intention over the next week or two is to finish linking the Time Series audio and then to create a linking form (URL builder) for the IEB and or 3D viewer.
Stupendous tool Sir and one that should be promulgated around the world. I shall do my best. I might even do a stand alone 'URL Builder' for it (Windows only I am afraid).
edit on 20/10/2013 by PuterMan because: Ah, the inevitable speeling erra
PS the pop-up list and zoom to (see image above) is a nice feature as well.
edit on 20/10/2013 by PuterMan because: (no reason given)
update to post by PuterMan
I have sent the following to Tim, cc'd to Rob
Here's hoping!
I have sent the following to Tim, cc'd to Rob
Having had some time to play with the new 3D viewer in IEB I have to say that this is one of the most useful tools available on the web and pretty much unique.
The lack of ability to produce such plots without resorting to MatLab and other tools that are beyond the reasonable use of ordinary earthquake nerds (of which there are very many) was a most frustrating thing. The 3D view has plugged that gap.
There are some things that could enhance this further on the input and selection side – applicable to the IEB selection as far as Latitude and Longitude are concerned – and other things that would greatly enhance its usability (I won’t list them here but I have a few ideas). My thanks to IRIS for producing such a wonderful tool, but don’t rest on your laurels as it can be improved and enhanced to great benefit for the scientific and public consumers.
I am still interested to know where we stand on the webicorder viewer about which we have spoken, and in particular the fix to the VH? Channel display. This again is another fantastic tool that needs some work when your team have time.
Here's hoping!
reply to post by rosswellian
Hows about.........
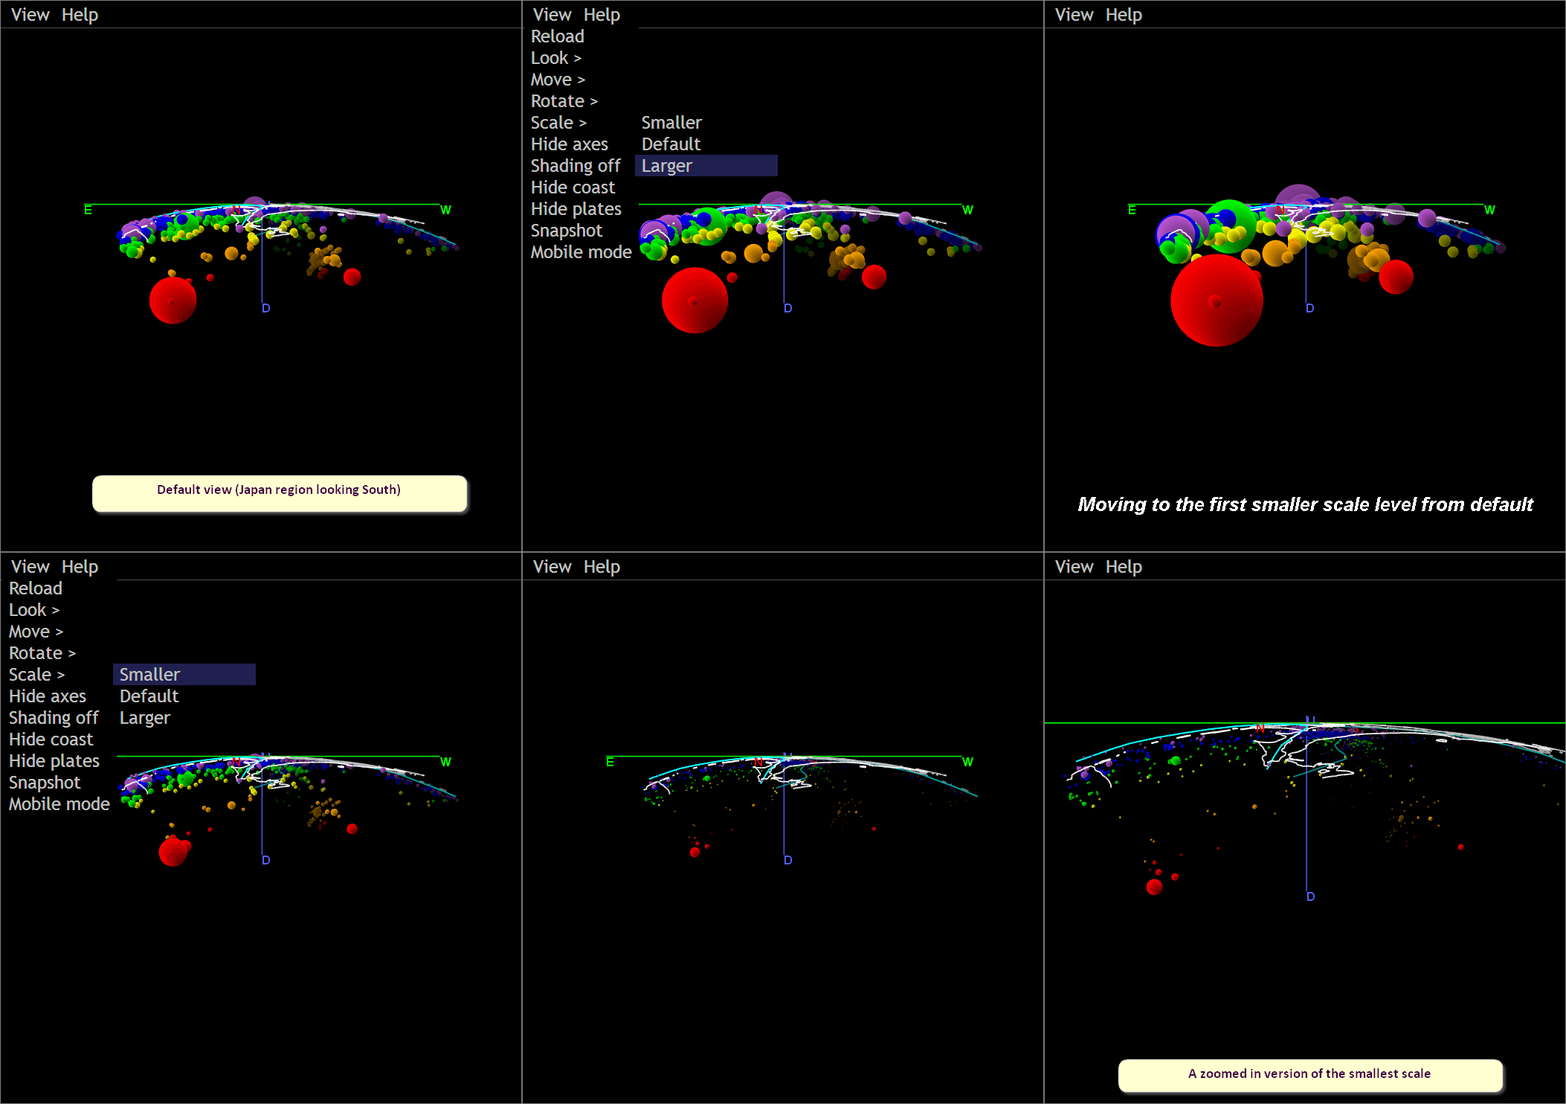
Had I more energy I would upload snaps of the before/after of the simple action of View / Scale / Smaller
Hows about.........

edit on 20/10/2013 by PuterMan because: (no reason given)
rosswellian
further to my "wish list item" a few pages back about a searchable lat/long menu on IEB ..............
I have been using Wilber 3 and Spud for a few months to get Travel Time data and MTS's for larger events and note that perhaps it might be easily combined with IEB and 3DV programs also??????????????
Here is a screenshot of the proceedure.
The map is created by entering the lat/long co-ordinates, rather than by creating a random box/rectangle on the map.
The end result is a map and a downloadable list, but it could possibly open on IEB ????????????
 (click image for larger
version, opens in new tab/window)
for those who haven't found Wilber3 search page yet, the link is here
Note: The search area in the screenshot was for the seismic history around the M6.4-6.6 quake yesterday, either the Network's relocated the epi-centre by 140km, or I missed the spot completely, the M6.4 is right on the top edge now ????
further to my "wish list item" a few pages back about a searchable lat/long menu on IEB ..............
I have been using Wilber 3 and Spud for a few months to get Travel Time data and MTS's for larger events and note that perhaps it might be easily combined with IEB and 3DV programs also??????????????
Here is a screenshot of the proceedure.
The map is created by entering the lat/long co-ordinates, rather than by creating a random box/rectangle on the map.
The end result is a map and a downloadable list, but it could possibly open on IEB ????????????

for those who haven't found Wilber3 search page yet, the link is here
Note: The search area in the screenshot was for the seismic history around the M6.4-6.6 quake yesterday, either the Network's relocated the epi-centre by 140km, or I missed the spot completely, the M6.4 is right on the top edge now ????
edit on 10u29229213 by muzzy because: (no reason
given)
reply to post by muzzy
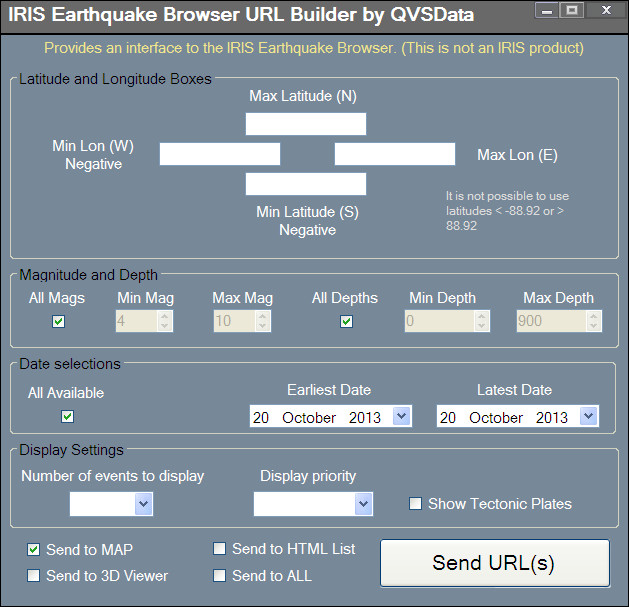
I am building a stand alone URL Builder for IEB/IEB HTML List /IEB viewer which will be finished later today but for a single question about the sz parameter
@RW can you tell me the parameters that control SZ=? If you can get to your messages I have given my email address rather than conduct the nitty gritty on the thread. If you cannot respond on the message area because you do not have enough posts, no problem.
Here is a screen-shot of what is coming.....
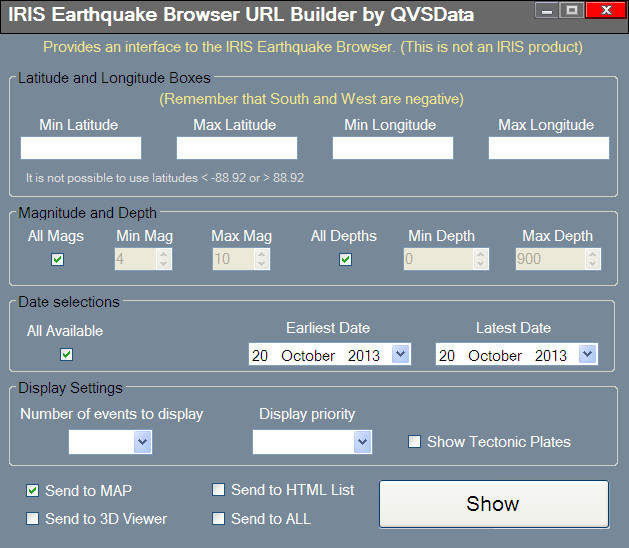
On second thoughts, in the light of Muzzy's comment, I changed the screen layout.
I am building a stand alone URL Builder for IEB/IEB HTML List /IEB viewer which will be finished later today but for a single question about the sz parameter
@RW can you tell me the parameters that control SZ=? If you can get to your messages I have given my email address rather than conduct the nitty gritty on the thread. If you cannot respond on the message area because you do not have enough posts, no problem.
Here is a screen-shot of what is coming.....

On second thoughts, in the light of Muzzy's comment, I changed the screen layout.

edit on 20/10/2013 by PuterMan because: (no reason given)
reply to post by BO XIAN
What can I say?
Effuse away!
I'll be happy to take care of the effusiveness end of things.
I'm pretty effusive about you two, as well. LOL.
What can I say?
Effuse away!
Interesting ......................
I always thought ANSS was the bees-knees for N. American data, but it seems this is not so.
Using the same parameters for searching both ANSS and IRIS, these are the results
IRIS (click image for interactive map, opens in new tab/window)
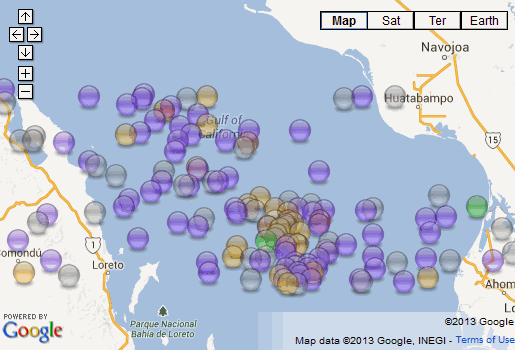
IEB 3DV static image
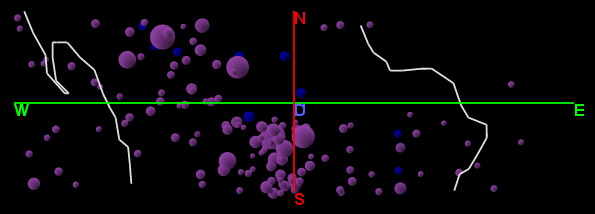
ANSS (click image for interactive map, opens in new tab/window)
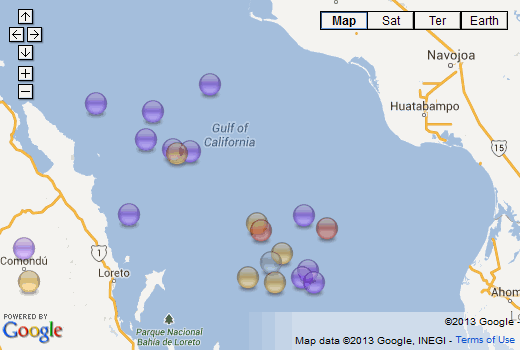
Note:I should have kept the IEB 3DV link for the cross section, but too late now, and I haven't got time to randomly search the map again.
oopps never mind, I had made a mistake on the start dates, had 1970 for IRIS but 2007 for ANSS.
enjoy the pretty maps anyway, I have to go to work now
I always thought ANSS was the bees-knees for N. American data, but it seems this is not so.
Using the same parameters for searching both ANSS and IRIS, these are the results
IRIS (click image for interactive map, opens in new tab/window)

IEB 3DV static image

ANSS (click image for interactive map, opens in new tab/window)

Note:I should have kept the IEB 3DV link for the cross section, but too late now, and I haven't got time to randomly search the map again.
edit on 1000000029229213 by muzzy because: (no reason given)
oopps never mind, I had made a mistake on the start dates, had 1970 for IRIS but 2007 for ANSS.
enjoy the pretty maps anyway, I have to go to work now
edit on 10u29229213 by muzzy because: (no reason given)
reply to post by muzzy
Thx Muzzy
imho,
It would be a great help with the Lat Long options to have the Lat & Long of the current cursor location displayed in an easily spotted place on the map when one is expected to input such into their slots.
Thx Muzzy
imho,
It would be a great help with the Lat Long options to have the Lat & Long of the current cursor location displayed in an easily spotted place on the map when one is expected to input such into their slots.
reply to post by rosswellian
When you do get a moment to reply there are some points about URL building I would like to address such as the parameters order and the nomenclature of some parameters. Also to discuss whether the menu items such as 'Look North' could be parameterised as they do not affect the URL.
When you do get a moment to reply there are some points about URL building I would like to address such as the parameters order and the nomenclature of some parameters. Also to discuss whether the menu items such as 'Look North' could be parameterised as they do not affect the URL.
reply to post by BO XIAN
Hi, thanks again mightily for the ideas and suggestions for things to play with.
I am keeping a document now with all the suggestions from this forum which I will collate and refine when I have time, hopefully soon.
One feature I probably will be adding soon is "Vertical Axis / [Compress | Expand] so that some small or oblong regions that don't work well can have their Z axis expanded, to separate the spheres (or shapes!) and let one see better into the mess, or bring an exaggerated Z axis into a more manageable, smaller scale.
More soon, rosswellian
ps.
Is discussion like this generally done in the forum or is it preferred to take it offline as in direct emails?
Don't want to bore the crowd.. or transgress.
I can't seem to find any good introduction to how to use this ATS board, it lacks in help files, or at least I don't see them. Managed to create an avatar just by guessing.
reply to post by muzzy
Thanks muzzy I have just constructed an email to the creator of Wiber III to suggest what you said, literally copied your post.
It is very definitely possible, as I can't believe Wilber doesn't know the lat lon boundaries, date ranges and so forth to construct a link dynamically into IEB (or 3DV for that matter).
** I am documenting the GET parameters for both IEB and 3DV right now, below **
Great idea I hope it is implemented soon, realistically before the holidays???
rosswellian
edit on 20-10-2013 by rosswellian because: update that useful info is added in a below post
reply to post by rosswellian
If the subject is earthquakes and the basic user details of how to use your tool then I doubt if the mods would have a problem.
If it starts getting into the nitty gritty of programming then that is outside the bounds of the thread and can be handled either by u2u or direct email.
I have an old version of my own help file for ATS but it won't be much use now. Needs updating. Another little job!!
Minor problem: What is being sent is not what is being used
ps.
Is discussion like this generally done in the forum or is it preferred to take it offline as in direct emails?
Don't want to bore the crowd.. or transgress.
I can't seem to find any good introduction to how to use this ATS board, it lacks in help files, or at least I don't see them. Managed to create an avatar just by guessing.
If the subject is earthquakes and the basic user details of how to use your tool then I doubt if the mods would have a problem.
If it starts getting into the nitty gritty of programming then that is outside the bounds of the thread and can be handled either by u2u or direct email.
I have an old version of my own help file for ATS but it won't be much use now. Needs updating. Another little job!!
Minor problem: What is being sent is not what is being used
edit on 20/10/2013 by PuterMan because: (no reason given)
reply to post by PuterMan
HI again,
I'm overwhelmed and so pleased to have found the group.
About the parameters (and this has relevance to future hooks to getting data from other than IRIS sources).
Almost all are the same as the IRIS web services.
for IEB here are the parms. I'll post 3DV separately.
[sorry the tabs screwed up the formatting]
www.iris.edu...
format=text NOT NEEDED. (for WS means vertical bar-separated values)
&nodata=404 NOT NEEDED. both are for compatability with WS but not needed
&starttime=1970-01-01 obvious; hour and min not supported
&endtime=2025-01-01 obvious
&minmag=0 obvious; negative and zero mags are not shown; there is a reason, another time...
&maxmag=10 obvious
&mindepth=0 obvious
&maxdepth=900 obvious
&orderby=time-desc obvious; the other option is mag-desc
&limit=200 obvious, max quakes
&maxlat=-0.851 obvious; three, maybe four digits of precision OK
&minlat=-2.852 obvious
&maxlon=101.393 obvious
&minlon=99.390 obvious
&sbl=1 "selection box locked" - if the lat/lons represent
a selection box, in blue, which is "locked"
(as they always are) locked is explained in help.
&pbl=1 wether to show plate boundary layer
&name=SOUTHERN%20SUMATERA obvious, html special chars should be encoded, like %20
undocumented:
&audience= we use codes like 'internal', 'k-12', 'museum' to tailor the
map, but not much use is currently made. if we do, i'll later
add that to help, but it is "future expansion" type thing
&caller= this allows you to say who you are, and I may tailor based on
arrangements we have. say you are 'urlb' (URL builder) then
you could request mods to the presentation/fucntion based
on my knowing where your viewer came in from...
&dbg=1 tons of output will go to the JavaScript console of your browser
reply to post by rosswellian
Thanks for all that. Most of it I have sussed out and my URL builder works - I just need to refine it a bit and may not finish that tonight but I will post it tomorrow morning.
On the lat lon I am not getting what I send (sending whole numbers as a test)
Top line was what was sent, bottom line what was produced.

edit on 20/10/2013 by PuterMan because: (no reason given)
reply to post by PuterMan
might need decimal for the send part,,, 13.00 ??? not sure. nice scripting
might need decimal for the send part,,, 13.00 ??? not sure. nice scripting
reply to post by rosswellian
THX TONS for your kind words.
YOU DO GREAT at dialogue here and this is a great place for it.
No sweat and no rush on any of my notions. Flush what's not fitting or worth it.
I like the idea of the compressing and expanding of a selected axis. Great idea.
You're a real trooper. Personally, the boss should probably pay you double whatever you're getting. But then, I'm biased in your favor. LOL.
Blessings,
edit on 20/10/2013 by BO XIAN because: tags
reply to post by rosswellian
DOODNESS. I just noticed you're in Seattle. Great place . . . though overly populated with folks with curious political . . . wellll anyway . . . lol.
I am curious, though . . . what elevation is your home at? How near a major fault is your home and your worksite?
What a city for one of your jobsite to be in! LOL.
new topics
-
Advice for any young Adult .
General Chit Chat: 34 minutes ago -
Joe meant what he said about Hunter's pardon....
US Political Madness: 1 hours ago -
Regent Street in #London has been evacuated due to a “bomb threat.”
Other Current Events: 2 hours ago -
It’s Falling…
Philosophy and Metaphysics: 3 hours ago -
Steering the Titantic from the Drydock.
Rant: 6 hours ago
top topics
-
Steering the Titantic from the Drydock.
Rant: 6 hours ago, 10 flags -
Hearing more ambulances lately
Medical Issues & Conspiracies: 17 hours ago, 8 flags -
Los Angeles brush fires latest: 2 blazes threaten structures, prompt evacuations
Mainstream News: 17 hours ago, 7 flags -
Paramilitary Leaks - John Williams
Whistle Blowers and Leaked Documents: 15 hours ago, 7 flags -
Joe meant what he said about Hunter's pardon....
US Political Madness: 1 hours ago, 7 flags -
It’s Falling…
Philosophy and Metaphysics: 3 hours ago, 4 flags -
Advice for any young Adult .
General Chit Chat: 34 minutes ago, 4 flags -
Some sausage, some chicken, some sauce, some onions and some garlic...and some peppers!
Food and Cooking: 17 hours ago, 3 flags -
Regent Street in #London has been evacuated due to a “bomb threat.”
Other Current Events: 2 hours ago, 3 flags
active topics
-
Steering the Titantic from the Drydock.
Rant • 32 • : Boomer1947 -
Joe meant what he said about Hunter's pardon....
US Political Madness • 8 • : BeyondKnowledge3 -
Advice for any young Adult .
General Chit Chat • 3 • : AlroyFarms -
Regent Street in #London has been evacuated due to a “bomb threat.”
Other Current Events • 3 • : TimBurr -
Los Angeles brush fires latest: 2 blazes threaten structures, prompt evacuations
Mainstream News • 20 • : BeyondKnowledge3 -
Russia Ukraine Update Thread - part 3
World War Three • 6902 • : Oldcarpy2 -
It’s Falling…
Philosophy and Metaphysics • 2 • : JJproductions -
Hearing more ambulances lately
Medical Issues & Conspiracies • 4 • : JJproductions -
Meta Llama local AI system is scary good
Science & Technology • 51 • : imitator -
Judge rules president-elect Donald Trump must be sentenced in 'hush money' trial
US Political Madness • 65 • : network dude
