It looks like you're using an Ad Blocker.
Please white-list or disable AboveTopSecret.com in your ad-blocking tool.
Thank you.
Some features of ATS will be disabled while you continue to use an ad-blocker.

Ebola - my visual charts & projections based on WHO data
page: 21share:
Sorry for spamming. After reading a few pdfs, it seems that the accepted simplified level for herd immunity is 1 - 1/r0. This is relatively good news.
With an r0 of 2, burn out would occur when 50% of the population had immunity. That means that for every person who survives the infection, another
person survives without infection. If survival rates of 30% are maintained this would mean a maximum 40% fatality rate.
a reply to: ikonoklast
From the WHO:
From the WHO:
WHO is alarmed by media reports of suspected Ebola cases imported into new countries that are said, by government officials or ministries of health, to be discarded as “negative” within hours after the suspected case enters the country.
Such rapid determination of infection status is impossible, casting grave doubts on some of the official information that is being communicated to the public and the media.
a reply to: Micksy
No need to apologize. Thanks for contributing some interesting and useful information.
I was wondering how these factors would affect things in a worst case scenario. I assumed that as population went down and the percentage of the remaining population that would be recovered and/or immune went up it would reduce the likelihood of those without immunity coming in direct contact with Ebola. This info seems to confirm that and even helps with gut-level rough estimates.
I'm still hoping things won't get anywhere near this bad.
a reply to: soficrow
I'm glad someone with potential authority to affect protocols and procedures is as alarmed as me (and probably you and many others here) about this.
I've been getting really concerned every time I hear of people vomiting on people and in planes and train stations, running a fever, saying they have been in areas with Ebola or around people with Ebola, and then being dismissed with a wave of a hand as free of Ebola or by 'authorities' claiming they tested negative for Ebola when many of us here have known that's impossible in such a short time and without 2 tests done days apart.
I hope something gets done to correct this immediately, although I doubt it will.
Thanks so much for posting that! It's at least a glimmer of hope for sanity and common sense prevailing.
I had to look up sir models, but yes. I got my maths wrong though, on several counts. First, I was counting dead people as being protected by herd
immunity given by survivors. Second, the formula only gives a threshold at which point the virus begins to die out, it's not incredibly simple to
work out how many people would die before that happened. I'm sure it would have a noticeable impact on worst case projections, especially the lower
you can bring R0, but I don't feel confident in making any calculations.
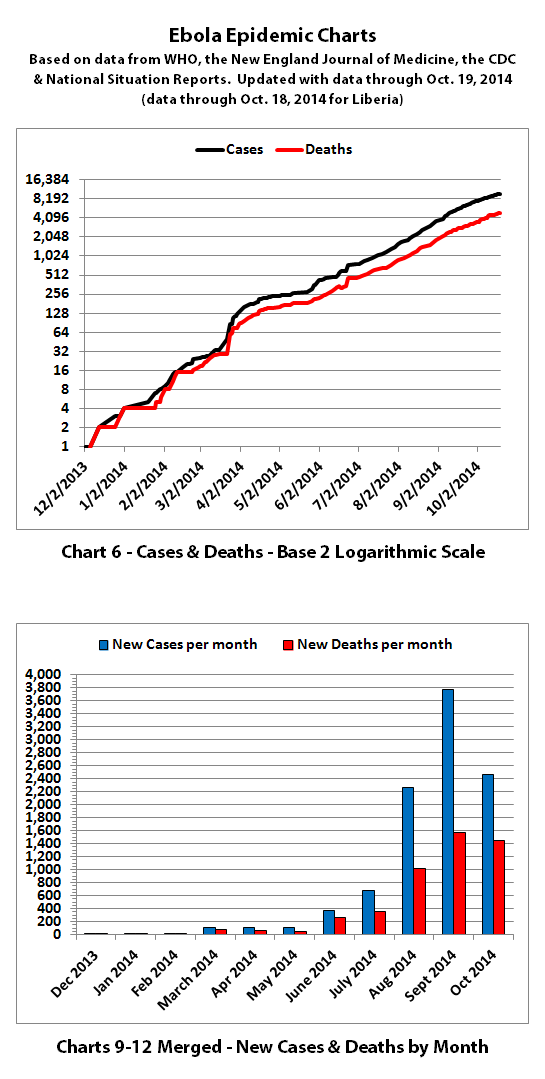
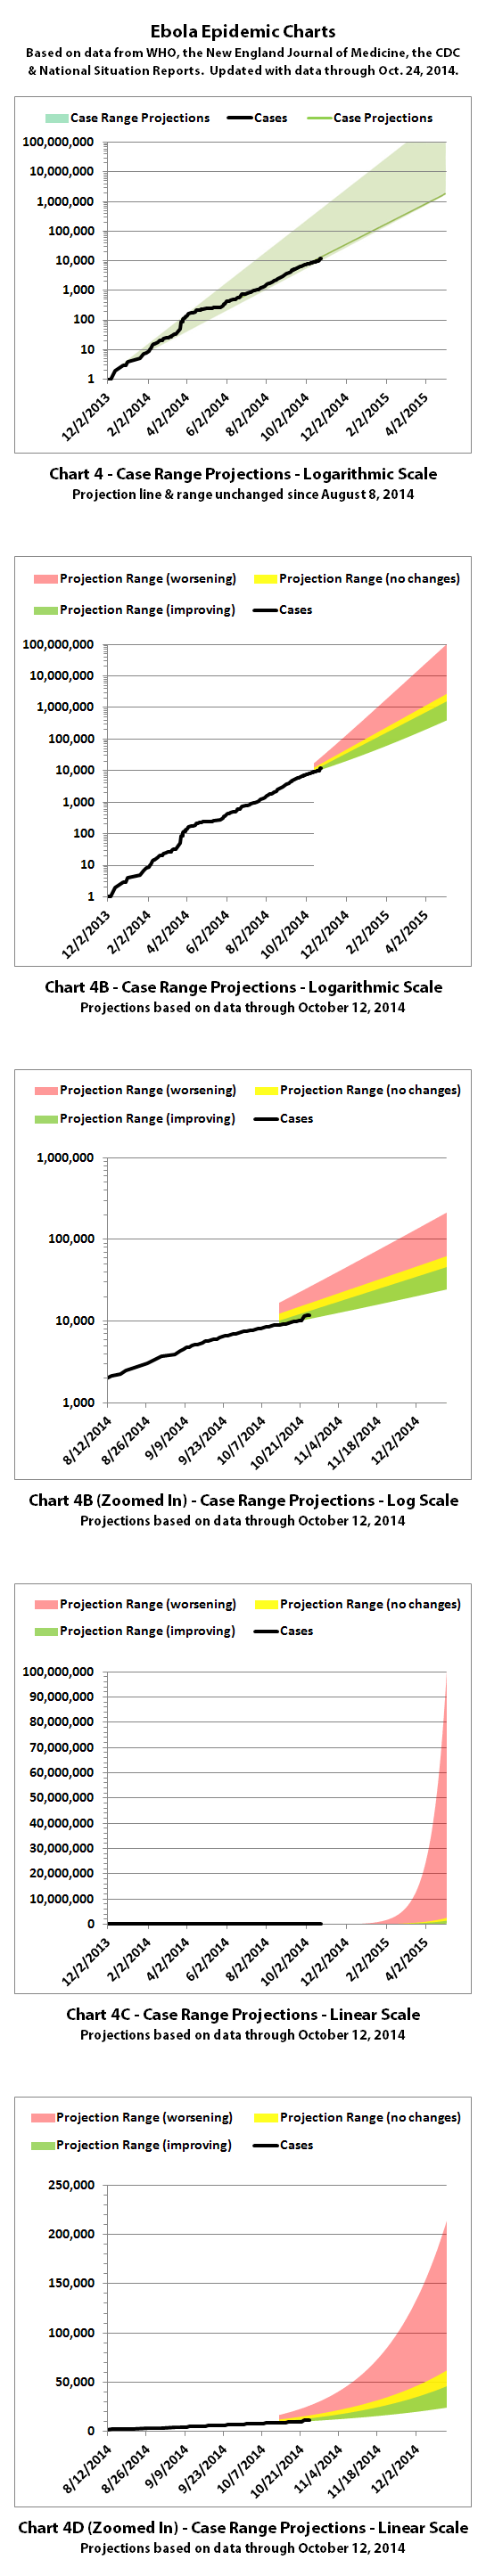
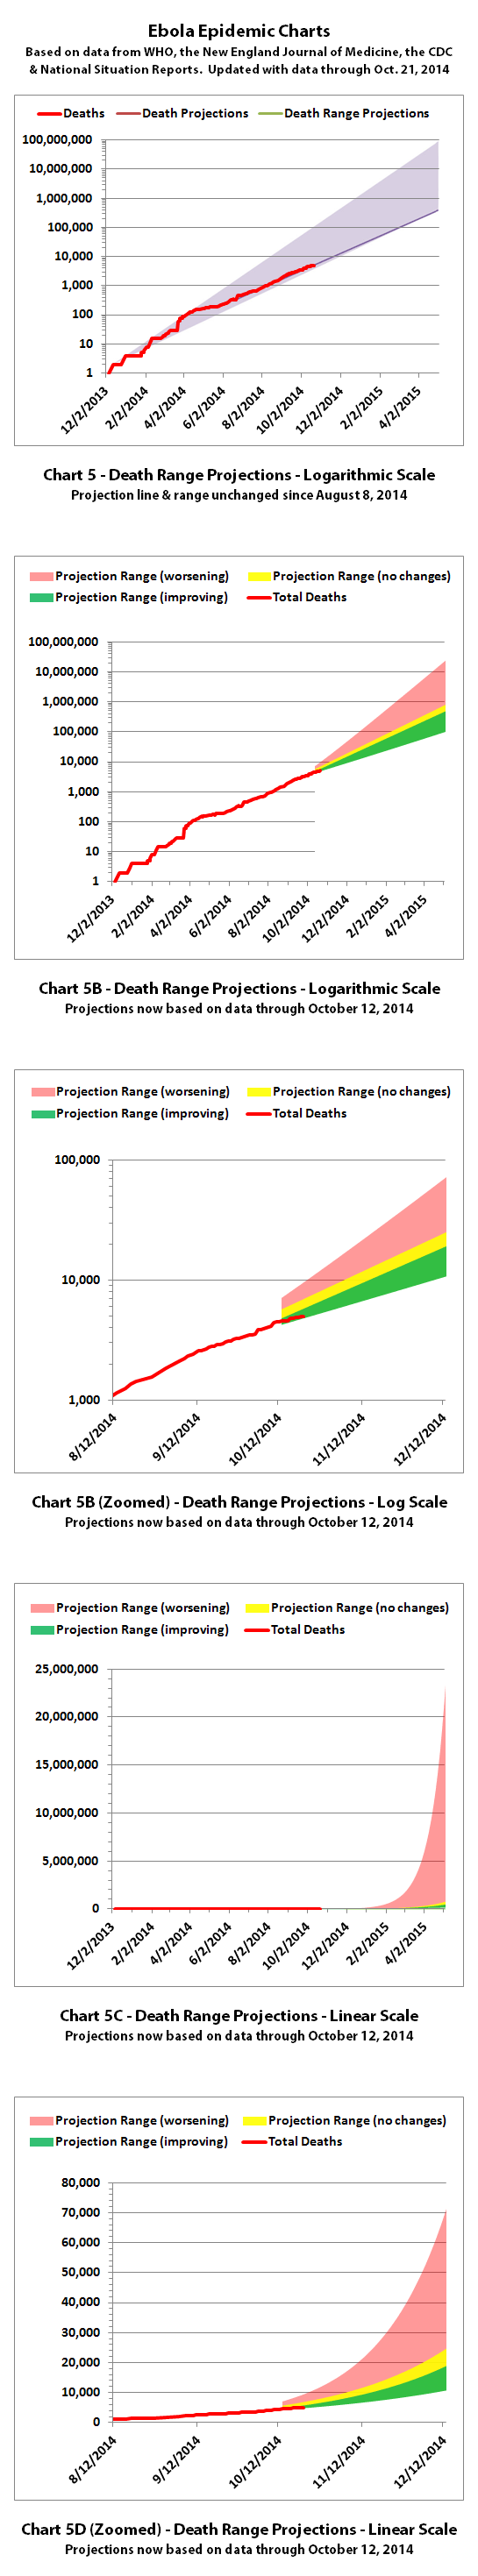
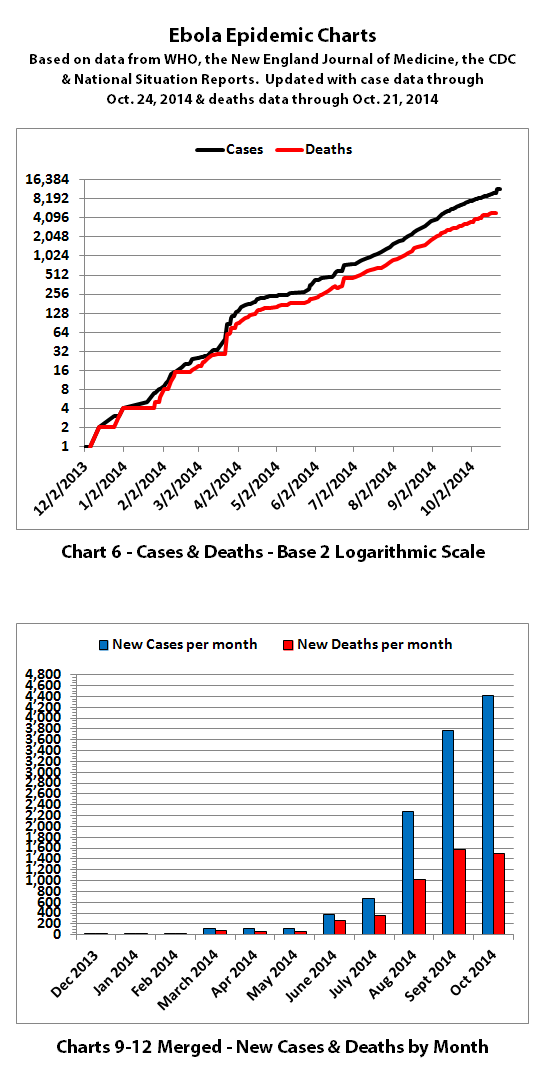
WHO released another Ebola update today. According to WHO, through October 19, 2014 (October 18, 2014 for Liberia), there were:
9936 reported cases
4877 reported deaths
I have updated the charts with the new data.
For Chart 3, I've gone back to using the projection lines from the very first version on August 4, 2014 because those projections have been amazingly accurate so far. You can see the original as well as the same projection lines with the additional months of data below for comparison.
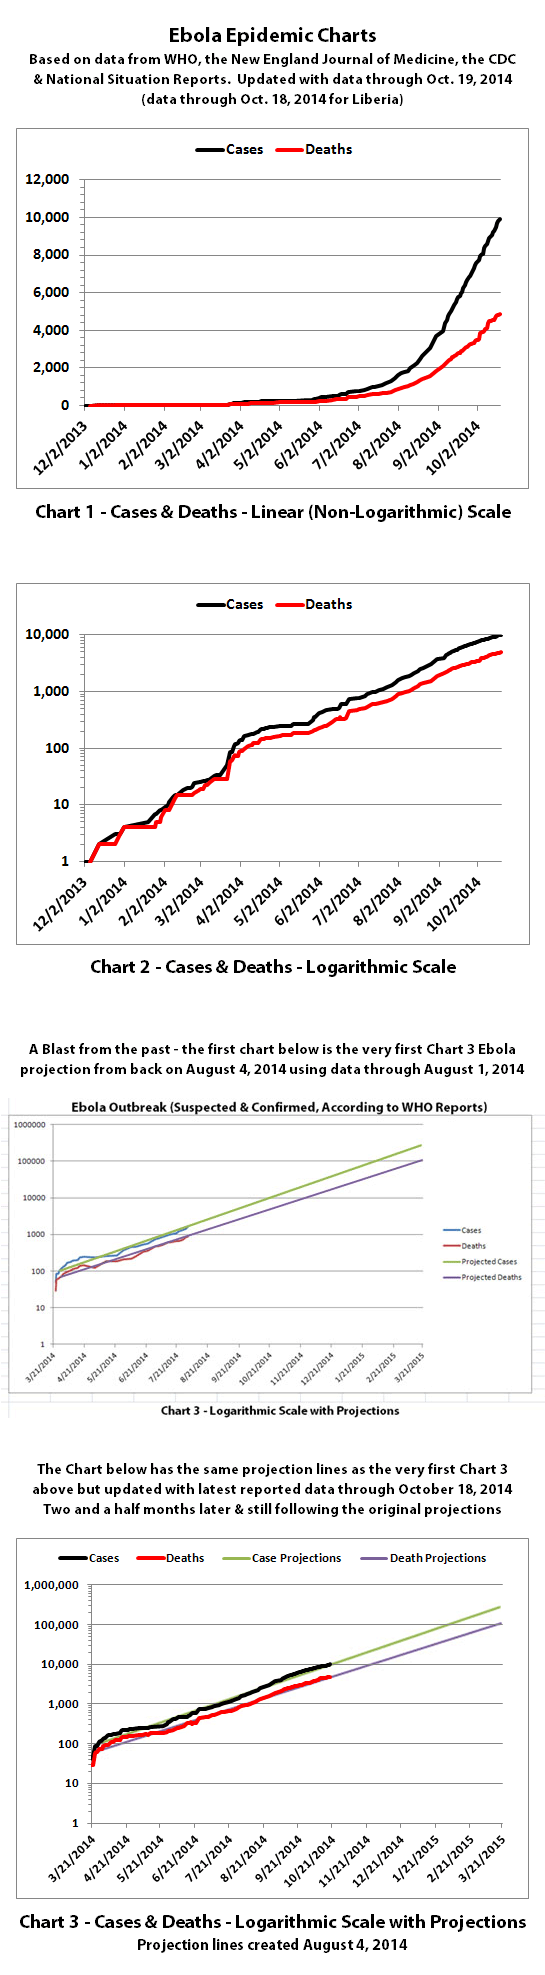
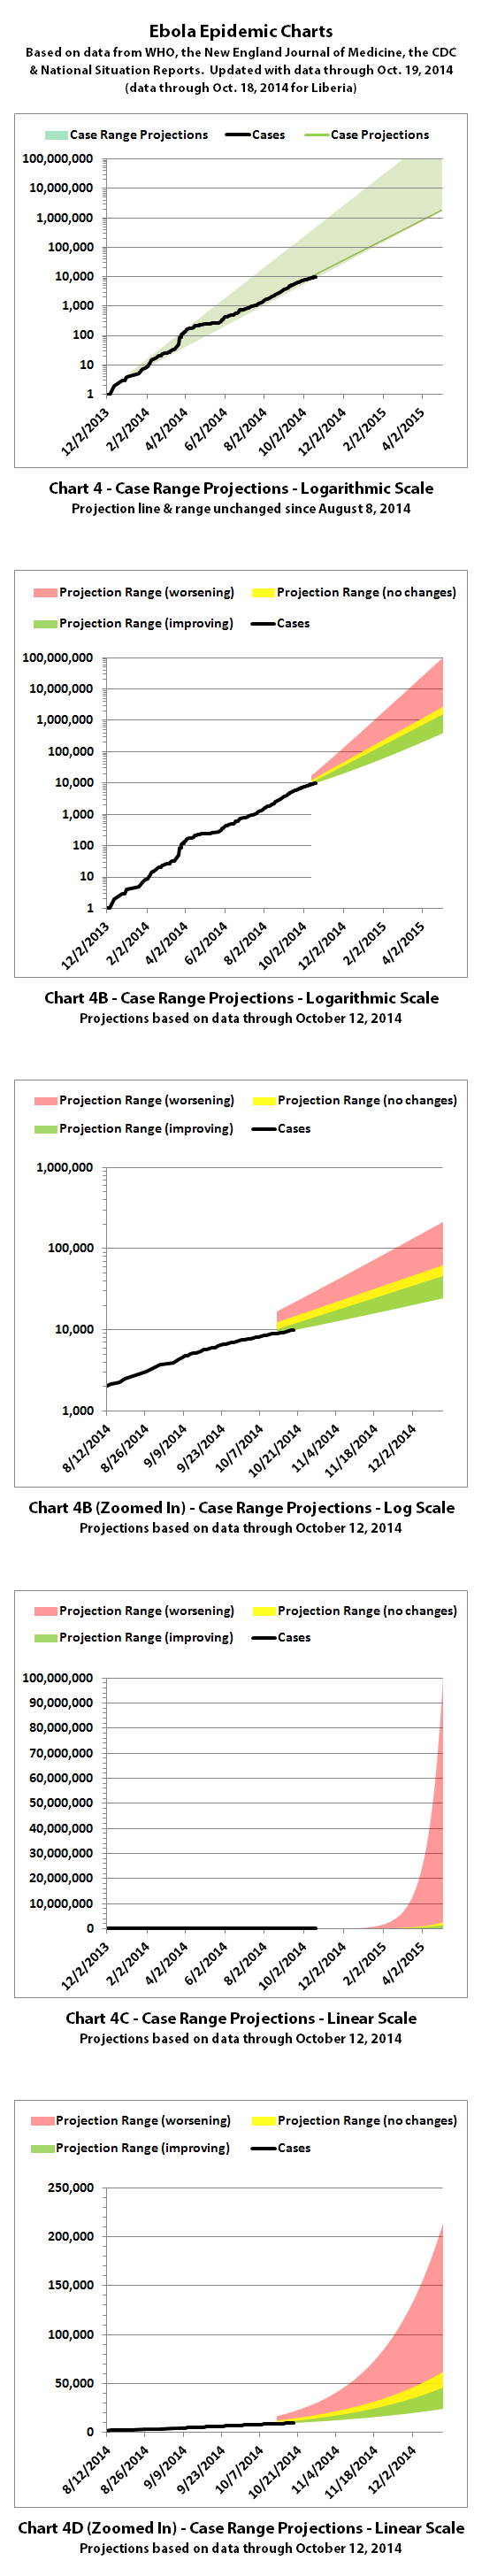
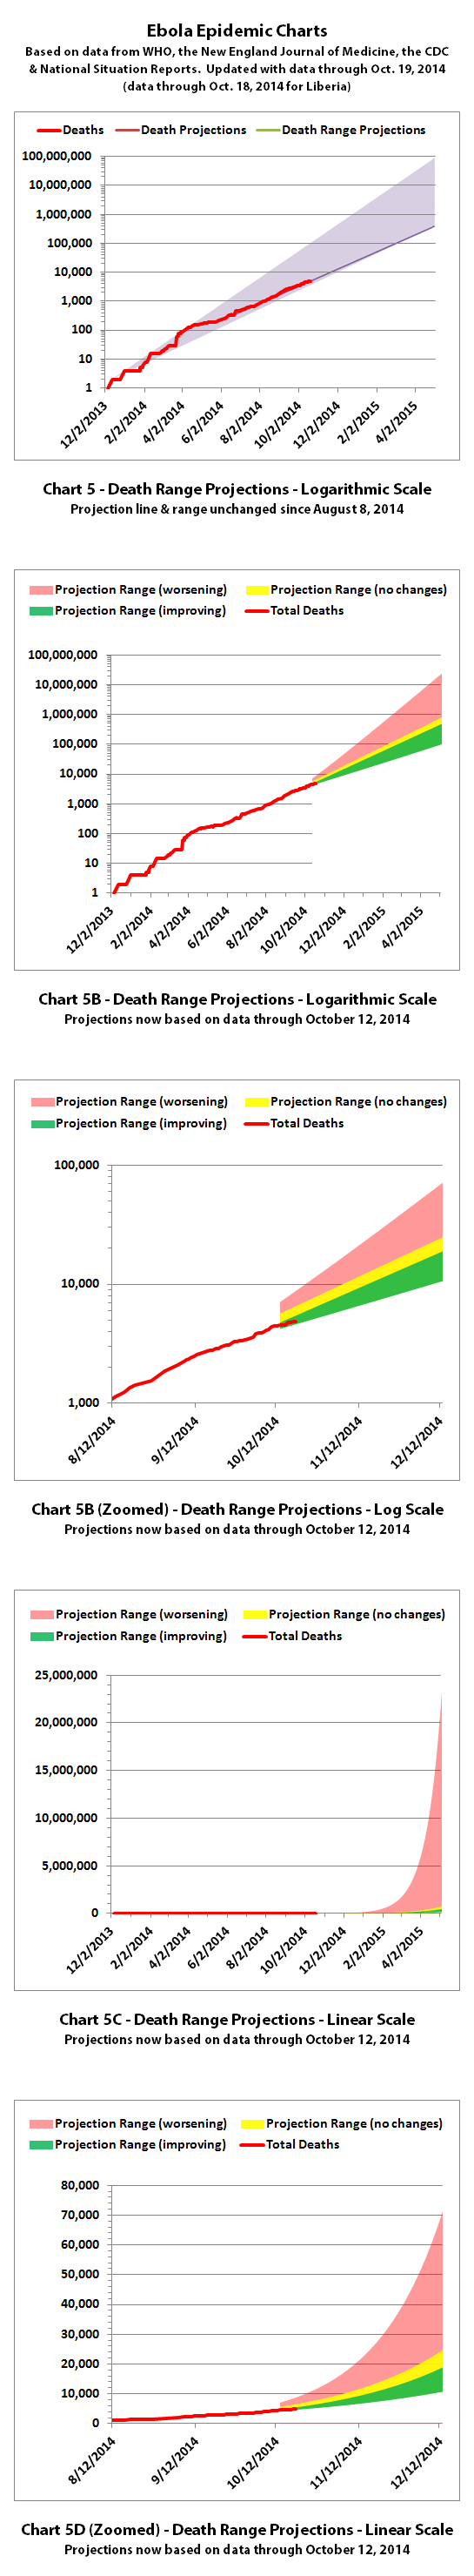
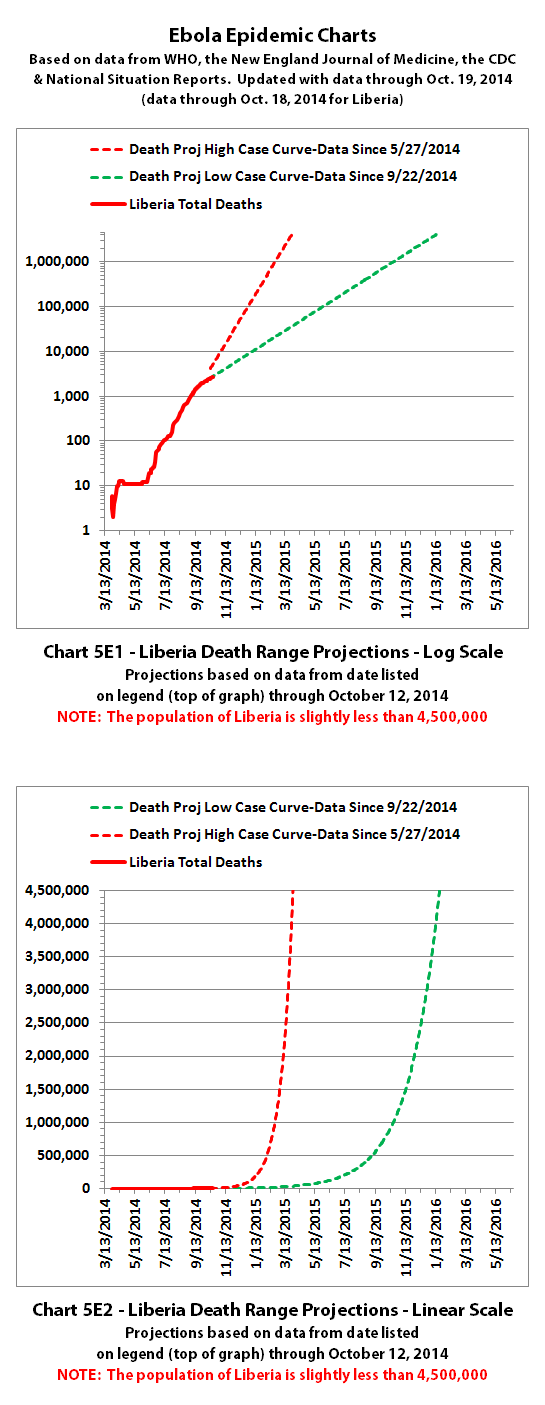
According to WHO,the CDC, and many charitable medical organizations such as Doctors Without Borders (MSF), it is believed that actual cases and deaths "vastly" outnumber reported figures. Most believe that there are at least 2 to 5 times as many cases and deaths. Since it is difficult to know exactly what the actual numbers are, these charts rely on the reported numbers.
WHO has also said the drop in reported new cases in Liberia over the last few weeks "...is unlikely to be genuine. Rather, it reflects a deterioration in the ability of overwhelmed responders to record accurate epidemiological data."
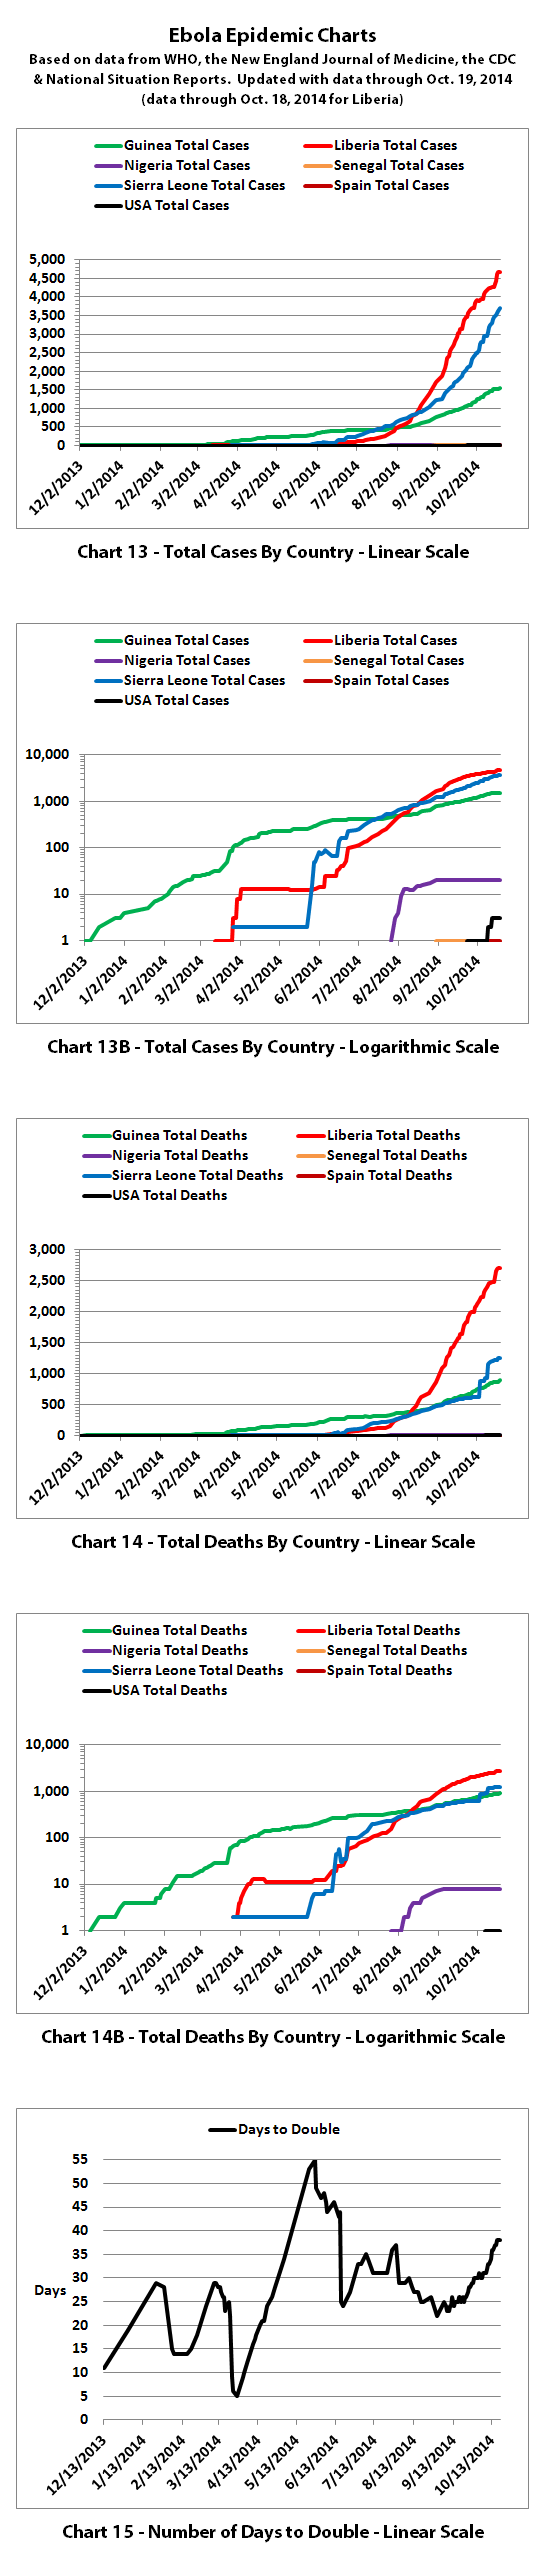
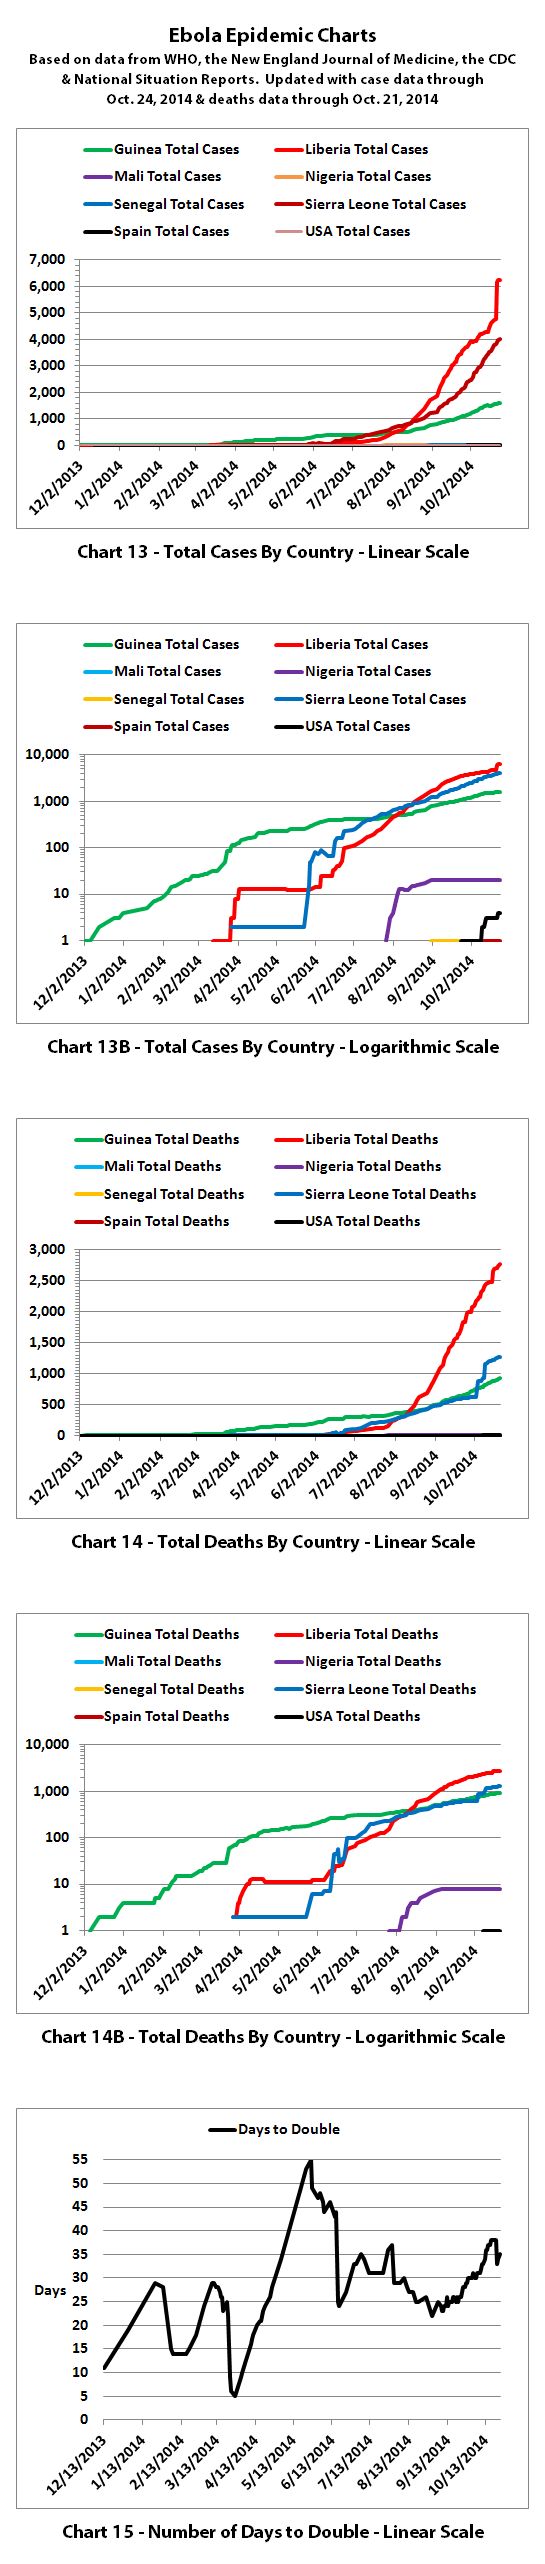
For Guinea, Liberia, Nigeria, Senegal, and Sierra Leone, WHO includes confirmed, probable, and suspected cases and deaths that are reported.
For other countries, WHO only includes three confirmed cases (in Dallas and Madrid) and one confirmed death (in Dallas). Additional probable and suspected cases have been reported in the news, but not by WHO. So far WHO is reporting "No data available" for probable and suspected cases in Spain and the USA.
The numbers also do not include the Congo, as that is allegedly an unrelated outbreak.
The same disclaimers and references apply to all of these charts:
Charts and future projections were done by me, not by WHO, except in cases where it is stated that a chart includes WHO projections. I am not an Ebola expert, epidemiologist, virologist, or MD, but I manually compiled the data used to create these graphs from news updates on the following WHO, CDC, and New England Journal of Medicine websites:
SOURCE: WHO website 1
SOURCE: WHO website 2
SOURCE: WHO website 3
SOURCE: WHO website 4
SOURCE: CDC website 1
SOURCE: The New England Journal of Medicine
In some cases, I also filled in data for dates between WHO updates using official situation reports released by the Ministries of Health of affected countries.
Please do not do anything you might regret based on charts or projections. Hopefully efforts to contain, quarantine, treat, prevent, or cure Ebola will eventually be successful, and hopefully sooner rather than later.
9936 reported cases
4877 reported deaths
I have updated the charts with the new data.
For Chart 3, I've gone back to using the projection lines from the very first version on August 4, 2014 because those projections have been amazingly accurate so far. You can see the original as well as the same projection lines with the additional months of data below for comparison.
According to WHO,the CDC, and many charitable medical organizations such as Doctors Without Borders (MSF), it is believed that actual cases and deaths "vastly" outnumber reported figures. Most believe that there are at least 2 to 5 times as many cases and deaths. Since it is difficult to know exactly what the actual numbers are, these charts rely on the reported numbers.
WHO has also said the drop in reported new cases in Liberia over the last few weeks "...is unlikely to be genuine. Rather, it reflects a deterioration in the ability of overwhelmed responders to record accurate epidemiological data."
For Guinea, Liberia, Nigeria, Senegal, and Sierra Leone, WHO includes confirmed, probable, and suspected cases and deaths that are reported.
For other countries, WHO only includes three confirmed cases (in Dallas and Madrid) and one confirmed death (in Dallas). Additional probable and suspected cases have been reported in the news, but not by WHO. So far WHO is reporting "No data available" for probable and suspected cases in Spain and the USA.
The numbers also do not include the Congo, as that is allegedly an unrelated outbreak.
The same disclaimers and references apply to all of these charts:
Charts and future projections were done by me, not by WHO, except in cases where it is stated that a chart includes WHO projections. I am not an Ebola expert, epidemiologist, virologist, or MD, but I manually compiled the data used to create these graphs from news updates on the following WHO, CDC, and New England Journal of Medicine websites:
SOURCE: WHO website 1
SOURCE: WHO website 2
SOURCE: WHO website 3
SOURCE: WHO website 4
SOURCE: CDC website 1
SOURCE: The New England Journal of Medicine
In some cases, I also filled in data for dates between WHO updates using official situation reports released by the Ministries of Health of affected countries.
Please do not do anything you might regret based on charts or projections. Hopefully efforts to contain, quarantine, treat, prevent, or cure Ebola will eventually be successful, and hopefully sooner rather than later.
Many thanks for putting these charts together!
Do they have long-range charts for Europe and the U.S.??
Do they have long-range charts for Europe and the U.S.??
a reply to: dianajune
You're welcome! Someone might have such charts, but I don't. There is not enough data yet to make projections for the USA or Europe based on reported cases or deaths, unless there are more known that are not being made public.
It's hard to judge how much is not being fully reported. In Africa, WHO normally breaks cases and deaths down into confirmed, probable, and suspected categories. But they are only reporting confirmed cases and deaths in the USA and Europe so far, saying there is no data available for probable and suspected. And they have not been including patients who caught Ebola in Africa and were flown to the USA or Europe for treatment, some of whom have also died.
a reply to: ikonoklast
Great thread once again OP you are one of my favorite posters on ATS. Phage is still number 1# even though I think he dislikes me views somewhat. I still agree with him 99% of the time.
I do have a question from the charts it look as if this is getting better in Africa? I am not an expert and I could be reading them wrong but hopefully I am right.
a reply to: SubTruth
Thanks!
I've been wondering the same thing... is it getting better in Africa?
Just looking at the charts and the numbers, it would appear so and I hope that it is. But when you look deeper, even WHO believes that they cannot rely on the numbers reported to them to be accurate, especially the numbers reported by Liberia and especially in Monrovia, Liberia. Liberia has also muzzled journalists, some of whom are complaining that they are not allowed to verify the numbers of new cases, deaths, etc.
I think you can get a pretty good picture of how things stand in Africa from the latest WHO situation report. It's only 12 pages, and you can skim it pretty quickly even if you have limited time:
WHO Situation report - 22 October 2014 (PDF)
My best guess, and I think WHO's best guess, is that it's getting better in some areas within the affected countries but not in others, and the sheer number of cases now makes it very difficult to contain and to treat or even isolate people, as there are not enough beds in treatment facilities. The UN, the CDC, and others estimate that they need to have treatment center beds to isolate 70% of cases by December to bring the Ebola epidemic under control and eventually end the epidemic.
Senegal and Nigeria are the two big success stories in Africa. Senegal only had one reported case, but they managed to contain it and prevent it from spreading. Nigeria had 20 cases, but they managed to contain it and prevent it from spreading. In both countries, more than 42 days have passed with no new cases reported since the end of the last known case, so the Ebola outbreaks in both have been declared over now.
If the reports are accurate for Senegal and Nigeria, the biggest lesson here seems to be that it is possible to contain Ebola if you catch it early and do excellent isolation, monitoring, and contact tracing.
Guinea appears to be doing the best of the three most affected countries. That's still not great though, because the spread continues at approximately the same exponential pace as since the beginning. But that rate is slower than in Sierra Leone or Liberia, and Guinea has 61% of the estimated number of treatment center beds needed. Not 70% yet, but much closer than in Sierra Leone or Liberia.
Sierra Leone is in bad shape, with the spread continuing at the same relatively high rate it has been for the last 4 months or so. They only have 29% of the estimated number of treatment center beds needed, far short of the needed 70%. That means about 71% of the cases are outside of treatment facilities and may not be sufficiently isolated.
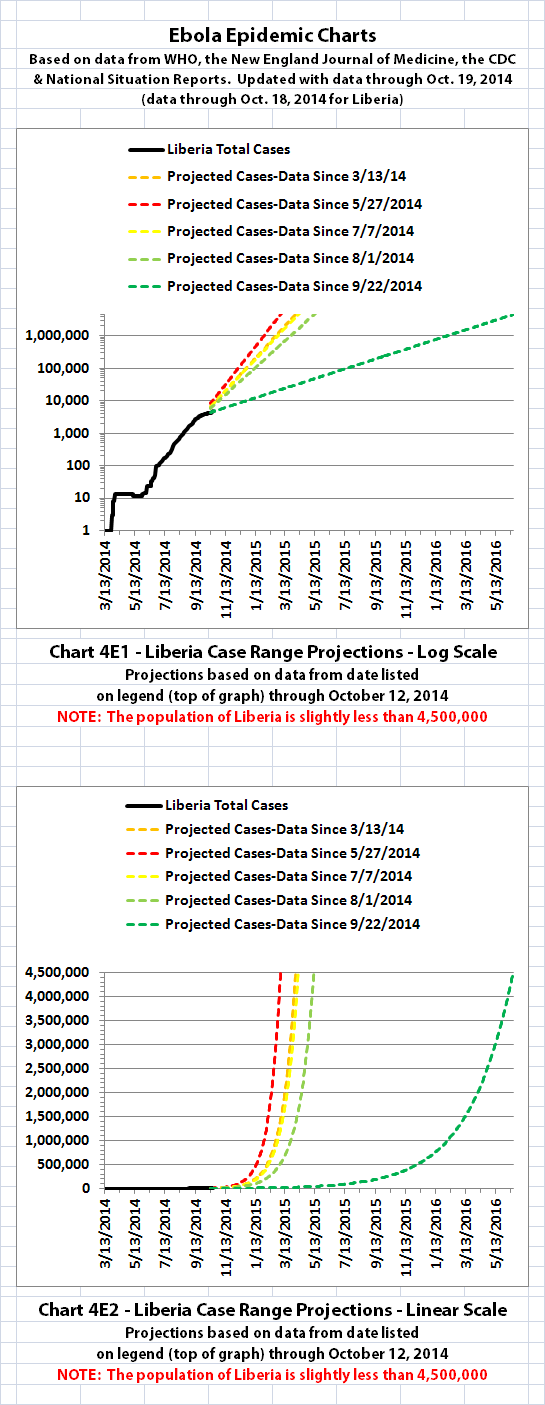
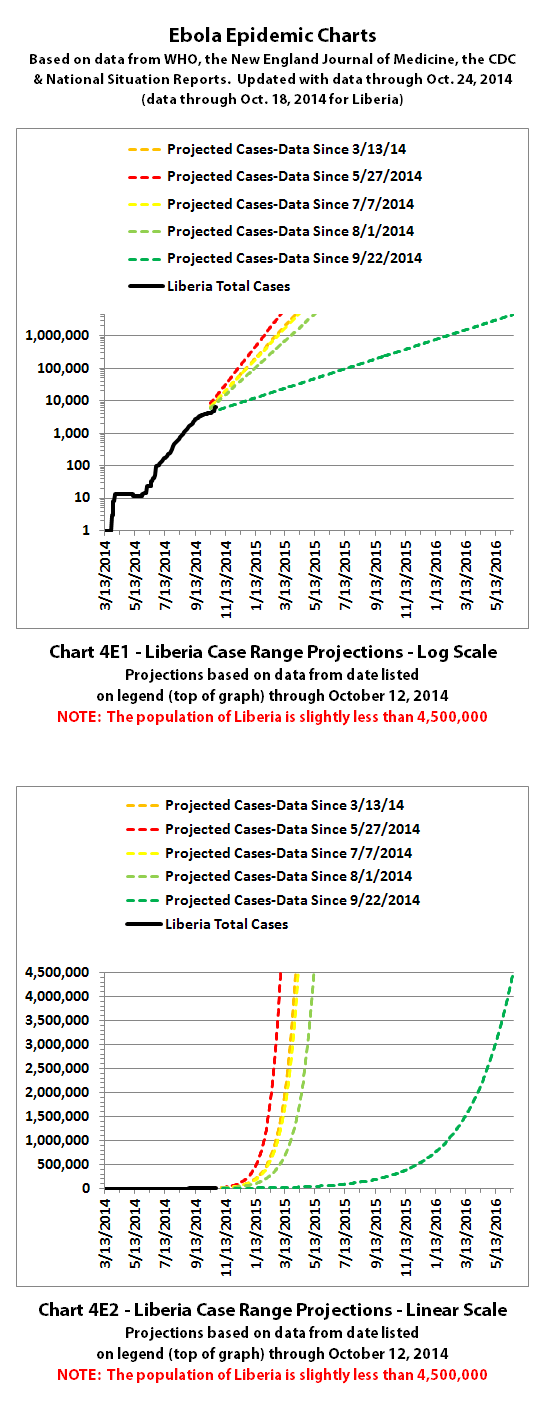
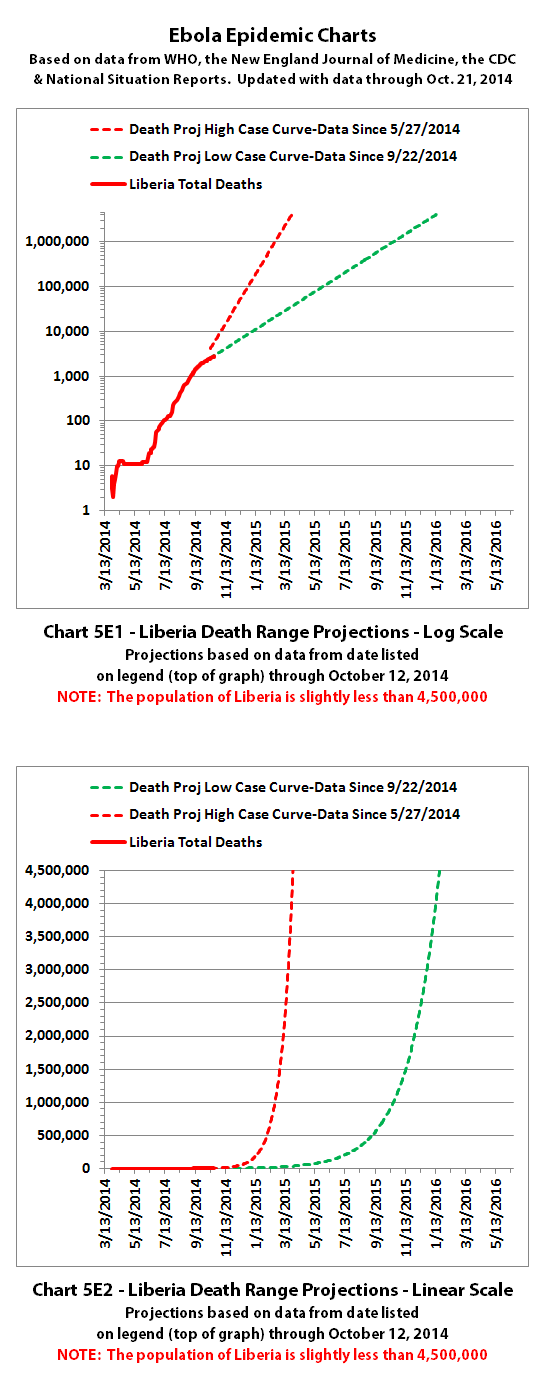
Liberia is the hardest hit country of all. Looking at the growth over the last 4-6 weeks the rate appears to have slowed. And since they have the largest number of cases and deaths, this makes the entire epidemic look like it is improving in most of the charts I've been doing.
But WHO thinks that it has not actually slowed down at all in Liberia. They say that it's grown to a point where Liberia can no longer keep up with reporting and confirming cases and deaths accurately. Or perhaps that is a diplomatic way of saying what others have said, that cases and deaths in Liberia may now be purposely under-reported to avoid panic. The recent clamp down on journalists reporting on Ebola in Liberia probably says a lot.
Liberia only has an estimated 23% of the treatment center beds they need, far short of the needed 70%. That means at least 77% of cases are outside of treatment facilities and may not be sufficiently isolated. So it does seem unlikely the growth of Ebola in Liberia would slow down yet.
Thanks!
I've been wondering the same thing... is it getting better in Africa?
Just looking at the charts and the numbers, it would appear so and I hope that it is. But when you look deeper, even WHO believes that they cannot rely on the numbers reported to them to be accurate, especially the numbers reported by Liberia and especially in Monrovia, Liberia. Liberia has also muzzled journalists, some of whom are complaining that they are not allowed to verify the numbers of new cases, deaths, etc.
I think you can get a pretty good picture of how things stand in Africa from the latest WHO situation report. It's only 12 pages, and you can skim it pretty quickly even if you have limited time:
WHO Situation report - 22 October 2014 (PDF)
My best guess, and I think WHO's best guess, is that it's getting better in some areas within the affected countries but not in others, and the sheer number of cases now makes it very difficult to contain and to treat or even isolate people, as there are not enough beds in treatment facilities. The UN, the CDC, and others estimate that they need to have treatment center beds to isolate 70% of cases by December to bring the Ebola epidemic under control and eventually end the epidemic.
Senegal and Nigeria are the two big success stories in Africa. Senegal only had one reported case, but they managed to contain it and prevent it from spreading. Nigeria had 20 cases, but they managed to contain it and prevent it from spreading. In both countries, more than 42 days have passed with no new cases reported since the end of the last known case, so the Ebola outbreaks in both have been declared over now.
If the reports are accurate for Senegal and Nigeria, the biggest lesson here seems to be that it is possible to contain Ebola if you catch it early and do excellent isolation, monitoring, and contact tracing.
Guinea appears to be doing the best of the three most affected countries. That's still not great though, because the spread continues at approximately the same exponential pace as since the beginning. But that rate is slower than in Sierra Leone or Liberia, and Guinea has 61% of the estimated number of treatment center beds needed. Not 70% yet, but much closer than in Sierra Leone or Liberia.
Sierra Leone is in bad shape, with the spread continuing at the same relatively high rate it has been for the last 4 months or so. They only have 29% of the estimated number of treatment center beds needed, far short of the needed 70%. That means about 71% of the cases are outside of treatment facilities and may not be sufficiently isolated.
Liberia is the hardest hit country of all. Looking at the growth over the last 4-6 weeks the rate appears to have slowed. And since they have the largest number of cases and deaths, this makes the entire epidemic look like it is improving in most of the charts I've been doing.
But WHO thinks that it has not actually slowed down at all in Liberia. They say that it's grown to a point where Liberia can no longer keep up with reporting and confirming cases and deaths accurately. Or perhaps that is a diplomatic way of saying what others have said, that cases and deaths in Liberia may now be purposely under-reported to avoid panic. The recent clamp down on journalists reporting on Ebola in Liberia probably says a lot.
Liberia only has an estimated 23% of the treatment center beds they need, far short of the needed 70%. That means at least 77% of cases are outside of treatment facilities and may not be sufficiently isolated. So it does seem unlikely the growth of Ebola in Liberia would slow down yet.
Just a quick note to everyone following this thread for chart updates, etc. I am going to be unavailable for the next several days - until Monday or
Tuesday next week. So I won't be able to do any chart updates until Tuesday or so at the earliest if new data comes out. And I probably won't be
posting on ATS or replying and if I am able to post at all, it will only be able to post on a very limited basis until then.
Don't worry, I will keep doing the updates after that! Many people have told me they really value the charts to help them follow what's going on, so I will do my best to continue as long as necessary or as long as they are wanted.
I guess on a more sinister note... if for some reason you don't see me back posting in this thread by next Tuesday or Wednesday, maybe someone has stuck an Ebola needle into me or something. No, I don't think that's likely. I'm not charting any data that isn't posted publicly, and anyone who looks at the data can see where the trends are obviously heading and construct the exact same projections from the same data. Just thought maybe I should point that out. I'm not sure we ever heard what became of that one air marshal that was stuck with a needle in an African airport a while back.
Looks like you will have to update your charts soon:
www.bbc.co.uk...
Dozens of people are being monitored in Mali after the country confirmed its first case of Ebola.
The patient is a two-year-old girl who recently arrived from Guinea.
With the latest case, Mali becomes the sixth West African country to be affected by the outbreak.
Malian authorities have now quarantined and are monitoring 43 people who have been in contact with the infected girl. They include 10 health workers.
The girl is being treated in the western town of Kayes.
Not looking good with the NYC case aswell.
ikon, for your charts...dunno if you've seen this yet. I'm sure you're on top of it
Official WHO Ebola toll near 5,000 with true number nearer 15,000
Official WHO Ebola toll near 5,000 with true number nearer 15,000
a reply to: ikonoklast
I was thinking about that air marshal and what happened to him . anybody found some news ?
armakirais
I was thinking about that air marshal and what happened to him . anybody found some news ?
armakirais
A big jump in the numbers for Liberia from 4,665 cases on 19 Oct 2014 to 6,253 cases on 24 Oct
Also the biggest % Daily growth overall of +4.1%
en.wikipedia.org...
Scroll down to the numbers.
Also the biggest % Daily growth overall of +4.1%
en.wikipedia.org...
Scroll down to the numbers.
I'm back, and here are the latest chart updates. While I was away, WHO released an update on October 25, 2014. But the numbers in their update are
almost unusable for charting purposes because of inconsistent data. They only had data through October 18 for Liberia, October 21 for Guinea, and
October 22 for Sierra Leone.
To overcome this issue, I have used the WHO data through those dates and then added case data through October 24 and death data through October 21 from national situation reports from affected countries. The reason the death data only goes through the 21st is that Liberia suddenly greatly reduced their reported deaths beginning on October 22, and I think we should wait and see whether WHO also does in their next update. Hopefully WHO's next update will have more consistent data.
Based on the combined WHO data and the situation reports, there were:
11,895 reported cases through October 24, 2014
4,979 reported deaths through October 21, 2014
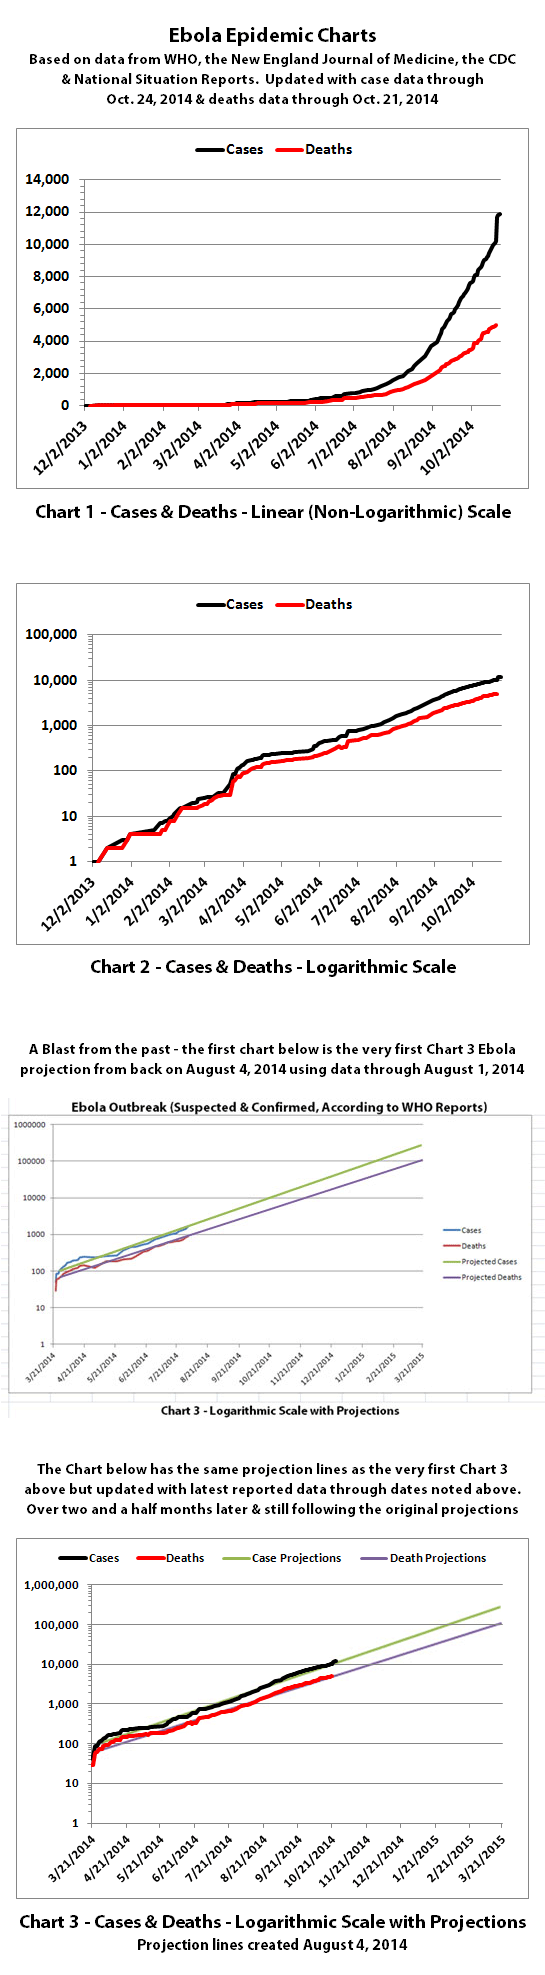
According to WHO,the CDC, and many charitable medical organizations such as Doctors Without Borders (MSF), it is believed that actual cases and deaths "vastly" outnumber reported figures. Most believe that there are at least 2 to 5 times as many cases and deaths. Since it is difficult to know exactly what the actual numbers are, these charts rely on the reported numbers.
WHO has also said the drop in reported new cases in Liberia over the last few weeks "...is unlikely to be genuine. Rather, it reflects a deterioration in the ability of overwhelmed responders to record accurate epidemiological data."
For Guinea, Liberia, Nigeria, Senegal, and Sierra Leone, WHO includes confirmed, probable, and suspected cases and deaths that are reported.
For other countries, WHO only includes three confirmed cases (in Dallas and Madrid) and one confirmed death (in Dallas). Additional probable and suspected cases have been reported in the news, but not by WHO. So far WHO is reporting "No data available" for probable and suspected cases in Spain and the USA.
The numbers also do not include the Congo, as that is allegedly an unrelated outbreak.
The same disclaimers and references apply to all of these charts:
Charts and future projections were done by me, not by WHO, except in cases where it is stated that a chart includes WHO projections. I am not an Ebola expert, epidemiologist, virologist, or MD, but I manually compiled the data used to create these graphs from news updates on the following WHO, CDC, and New England Journal of Medicine websites:
SOURCE: WHO website 1
SOURCE: WHO website 2
SOURCE: WHO website 3
SOURCE: WHO website 4
SOURCE: CDC website 1
SOURCE: The New England Journal of Medicine
In some cases, I also filled in data for dates between WHO updates using official situation reports released by the Ministries of Health of affected countries.
Please do not do anything you might regret based on charts or projections. Hopefully efforts to contain, quarantine, treat, prevent, or cure Ebola will eventually be successful, and hopefully sooner rather than later.
To overcome this issue, I have used the WHO data through those dates and then added case data through October 24 and death data through October 21 from national situation reports from affected countries. The reason the death data only goes through the 21st is that Liberia suddenly greatly reduced their reported deaths beginning on October 22, and I think we should wait and see whether WHO also does in their next update. Hopefully WHO's next update will have more consistent data.
Based on the combined WHO data and the situation reports, there were:
11,895 reported cases through October 24, 2014
4,979 reported deaths through October 21, 2014
According to WHO,the CDC, and many charitable medical organizations such as Doctors Without Borders (MSF), it is believed that actual cases and deaths "vastly" outnumber reported figures. Most believe that there are at least 2 to 5 times as many cases and deaths. Since it is difficult to know exactly what the actual numbers are, these charts rely on the reported numbers.
WHO has also said the drop in reported new cases in Liberia over the last few weeks "...is unlikely to be genuine. Rather, it reflects a deterioration in the ability of overwhelmed responders to record accurate epidemiological data."
For Guinea, Liberia, Nigeria, Senegal, and Sierra Leone, WHO includes confirmed, probable, and suspected cases and deaths that are reported.
For other countries, WHO only includes three confirmed cases (in Dallas and Madrid) and one confirmed death (in Dallas). Additional probable and suspected cases have been reported in the news, but not by WHO. So far WHO is reporting "No data available" for probable and suspected cases in Spain and the USA.
The numbers also do not include the Congo, as that is allegedly an unrelated outbreak.
The same disclaimers and references apply to all of these charts:
Charts and future projections were done by me, not by WHO, except in cases where it is stated that a chart includes WHO projections. I am not an Ebola expert, epidemiologist, virologist, or MD, but I manually compiled the data used to create these graphs from news updates on the following WHO, CDC, and New England Journal of Medicine websites:
SOURCE: WHO website 1
SOURCE: WHO website 2
SOURCE: WHO website 3
SOURCE: WHO website 4
SOURCE: CDC website 1
SOURCE: The New England Journal of Medicine
In some cases, I also filled in data for dates between WHO updates using official situation reports released by the Ministries of Health of affected countries.
Please do not do anything you might regret based on charts or projections. Hopefully efforts to contain, quarantine, treat, prevent, or cure Ebola will eventually be successful, and hopefully sooner rather than later.
a reply to: joho99
Thanks, I have updated the charts with what seems to be the latest 'official' data available, which includes the large increase in reported cases from Liberia.
Updated Ebola charts
Thanks, I have updated the charts with what seems to be the latest 'official' data available, which includes the large increase in reported cases from Liberia.
Updated Ebola charts
new topics
-
Mexico Plans Alert App For Migrants Facing Arrest In US
Mainstream News: 14 minutes ago -
Why Such An Uproar Over Non-US Citizens With H1-B Work Visas.
Social Issues and Civil Unrest: 4 hours ago -
Christmas Car Near Detroit…
Automotive Discussion: 6 hours ago -
Assetto Corsa EVO - a New Chapter in Simracing starts January 16th
Video Games: 9 hours ago
top topics
-
The Phenomenon documentary by James Fox
Aliens and UFOs: 12 hours ago, 7 flags -
Why Such An Uproar Over Non-US Citizens With H1-B Work Visas.
Social Issues and Civil Unrest: 4 hours ago, 6 flags -
Christmas Car Near Detroit…
Automotive Discussion: 6 hours ago, 5 flags -
The Looking Glass - Episode 3: The Path of Least Resistance
Short Stories: 16 hours ago, 3 flags -
New UK Petition - Close the borders! Suspend ALL immigration for 5 years!
Regional Politics: 13 hours ago, 2 flags -
Assetto Corsa EVO - a New Chapter in Simracing starts January 16th
Video Games: 9 hours ago, 2 flags -
Mexico Plans Alert App For Migrants Facing Arrest In US
Mainstream News: 14 minutes ago, 1 flags
active topics
-
Kurakhove officially falls. Russia takes control of major logistics hub city in the southeast.
World War Three • 11 • : Oldcarpy2 -
Why Such An Uproar Over Non-US Citizens With H1-B Work Visas.
Social Issues and Civil Unrest • 23 • : Echo007 -
Mexico Plans Alert App For Migrants Facing Arrest In US
Mainstream News • 0 • : xuenchen -
The Looking Glass - Episode 3: The Path of Least Resistance
Short Stories • 5 • : ChaoticOrder -
Petition Calling for General Election at 564,016 and rising Fast
Political Issues • 173 • : argentus -
President-elect Trump asks the Supreme Court to Let Tik-Tok Continue Operating in the U.S..
Mainstream News • 28 • : xuenchen -
Credit card debt
Relationships • 4 • : JadedGhost -
Plane Crash Today --Azerbaijanian E190 passenger jet
Mainstream News • 66 • : BernnieJGato -
Assetto Corsa EVO - a New Chapter in Simracing starts January 16th
Video Games • 2 • : gortex -
Parker Solar Probe is about to Kiss the Sun
Space Exploration • 11 • : Skinnerbot