It looks like you're using an Ad Blocker.
Please white-list or disable AboveTopSecret.com in your ad-blocking tool.
Thank you.
Some features of ATS will be disabled while you continue to use an ad-blocker.

Quake Watch 2012
page: 47share:
Originally posted by PuterMan
reply to post by ButterCookie
Have you got a burr under your saddle or something?
Give it up. It is over and done with.edit on 15/2/2012 by PuterMan because: (no reason given)
You would love it to be, but it really will be when you allow people to post their quake finds, emotions, and opinions without trying to distract any attention they may receive.
Are we all good now?
Sorry to interrupt the arguing but there was just a (mag-2.5) 9 miles from Lincoln City Oregon . . . I cannot figure out how to post the image of the
details . . .
Here is a link though:
earthquake.usgs.gov...
I am sure that this is probably nothing but figured it was of interest to some here.
Here is a link though:
earthquake.usgs.gov...
I am sure that this is probably nothing but figured it was of interest to some here.
edit on 15-2-2012 by nonnez because: formatting
reply to post by PuterMan
Now Folks you have to remember Mr. PM S aid many times (:lol he will be the one who claims that when all heck is breaking loose that he will claim it all is good with the world and there is nothing to see here
ATS members and the rest of the world = what is that huge object on fire headed straight for us coming from the moon
MP S ays = Nothing to worrie about folks I ran it through my program and it has happened before many times last times being 750k years ago, but we survived and then again 74k years ago -
and then our good Mr. MP S amples us with his great little graphs that we love so much!!!
P.S. Dear Mr. PM could you include the activity to date on our happy charts - I do love them you know!!!
Um, folks, take a look at this innocuous little earthquake:
USGS
Now, take a look at where the antipodal point for this little nothing of a quake is.
I know that the data are inconclusive for antipodal activity and earthquakes although there is enough to hint that there is a dynamic there which is intriguing and worth a look at. I know also that it's more pronounced in major impact events, but in light of recent activity, this kind of popped out to me.
I also was mesmerized by the earthquake animation @ USGS' website.
btw: PM, i like the longgraphs
P.S. Buttercookie, if you're basing your current stint on the soapbox (not saying you shouldn't be saying what you've said, and in fact I can see where you are coming from in some of your posts) on PM's bashing of the NatGeo stuff, I seem to recall that his position was that he NatGeo "scientists" were somewhat cherry picking their data (and that data was also a bit dated) and he was then able to produce more recent telemetry (directly from the seismos and GPS stations) indicating that the current status of the area was in a "deflation" stage. There are uplifts and then those receed, it's cyclic.
He did all of this in trademarked Puterman style, which is brusque and condescending (as he admits to the former if not the latter) at times. I don't think he critiqed you directly, but rather your source which is not the same. Heck he shot down one of my posts back on "talk like a pirate day" when I linked a paper by a "scientist" he roundly berates and denigrates regularly. I pointed out to him that it was a paper I found on the Cornell University Database, he also made a point of posting that it was that scientist he was deriding and not me.
Maybe he missed making such a point clear in his response to you, but unless you yourself have proven to be a fool (and you have not ever done so that I am aware of), I don't think he has been any more grumpy than normal.
I like your posts or the most part, thak you for beginning a discussion here. No "buts."
Magnitude 4.8
Date-Time Thursday, February 09, 2012 at 11:21:09 UTC Thursday,February09,2012at 02:21:09PM at epicenter Time of Earthquakein otherTimeZones
Location 41.097°S, 44.656°E
Depth 15.4 km (9.6 miles)
Region CROZET ISLANDSREGION
Distances 714 km (443 miles) NW of Ile aux Cochons, Crozet Islands 850 km (528 miles) NE of Marion Island, Prince Edward Islands 1753 km (1089 miles) SE of Durban, South Africa 2014 km (1251 miles) SSE of MAPUTO, Mozambique
Location Uncertainty horizontal+/- 20.7 km (12.9 miles);depth +/- 3.7km (2.3miles)
Parameters NST= 63, Nph= 65, Dmin=829.3 km, Rmss=1.1 sec, Gp=104°, M-type=body wave magnitude (Mb), Version=5
Source Magnitude: USGSNEIC (WDCS-D) Location: USGSNEIC (WDCS-D)
Event ID usb0007y8x
USGS
Now, take a look at where the antipodal point for this little nothing of a quake is.
I know that the data are inconclusive for antipodal activity and earthquakes although there is enough to hint that there is a dynamic there which is intriguing and worth a look at. I know also that it's more pronounced in major impact events, but in light of recent activity, this kind of popped out to me.
I also was mesmerized by the earthquake animation @ USGS' website.
btw: PM, i like the longgraphs
P.S. Buttercookie, if you're basing your current stint on the soapbox (not saying you shouldn't be saying what you've said, and in fact I can see where you are coming from in some of your posts) on PM's bashing of the NatGeo stuff, I seem to recall that his position was that he NatGeo "scientists" were somewhat cherry picking their data (and that data was also a bit dated) and he was then able to produce more recent telemetry (directly from the seismos and GPS stations) indicating that the current status of the area was in a "deflation" stage. There are uplifts and then those receed, it's cyclic.
He did all of this in trademarked Puterman style, which is brusque and condescending (as he admits to the former if not the latter) at times. I don't think he critiqed you directly, but rather your source which is not the same. Heck he shot down one of my posts back on "talk like a pirate day" when I linked a paper by a "scientist" he roundly berates and denigrates regularly. I pointed out to him that it was a paper I found on the Cornell University Database, he also made a point of posting that it was that scientist he was deriding and not me.
Maybe he missed making such a point clear in his response to you, but unless you yourself have proven to be a fool (and you have not ever done so that I am aware of), I don't think he has been any more grumpy than normal.
I like your posts or the most part, thak you for beginning a discussion here. No "buts."
edit on 16-2-2012 by jadedANDcynical because: no not
not
reply to post by Anmarie96
What asteroid? Nothing to see. Move along! Yes, I am a bit like that I accept. "The boy stood on the burning deck" and all that. Not quite the same but the principle is.
I will indeed update the data. I could not last night as the internet was down and I only have ANSS data to the end of 2011.
Normally I would not collect the Jan data until the end of February but I will created some temporary records i can replace later and run that chart again.
I will put them up this evening.
here in australia tonight, the history channel is playing a doco called "mega disasters". its all about the new madrid fault i hear a lot of you
americans talking about.....WOW....didnt realise aswell that its exactly 200 years since the last massive quakes here. 1811 and 1812 series of
quakes.
reply to post by jadedANDcynical
I know this is one of your favourites but you know, if there is not enough data you could get the data and prove it to your own satisfaction. I have said it before on the thread that there is evidence that asteroid impact has had this effect and there is certainly anecdotal information out there.
I don't have time to study it as I am trying to get my head round the Sun (no comments about how my head is big enough) and that is a massive subject BUT teaching you to suck eggs probably so that others can see it is a simple enough thing to do given some time.
First get yourself a list of whatever magnitude level you want to start at from the ANSS search page
For each quake calculate the antipodes
Find your latitude and longitude.
Calculate your antipodal longitude:
If your longitude > 0, (i. e. in the Eastern Hemisphere or +ve [positive]), add it to -180.
If your longitude< 0, (i. e. in the Western Hemisphere or -ve [negative]), subtract it from 180.
Your antipodal latitude is the same as your own latitude, swapping north with south or - with +
So taking the quake you posted Location 41.097°S, 44.656°E that is Latitude -41.097 which becomes Latitude 41.097, and Longitude 44.656 which is + so becomes -180+44.656 which is -135,344 or 135.244°W
On the ANSS search page you can use the delta function to get a circular search. (Note if you are not going back further than 1970 then the USGS Circular search is OK and is simpler) otherwise for the ANSS search the function goes in the additional parameters box. To save you reading all the bumf on how to use it I have shown an example here. It is delta=latitude,longitude,start radius, end radius

Setting the start radius to greater than 0 gives you a doughnut (or donut ) search.
I would probably recommend that you make the magnitude 0 to 10 and you will need to decide on what period after the date you would consider to be reasonable.
If you decide to accept this mission we look forwards to the results. This message will self destruct in 15 seconds.
I know that the data are inconclusive for antipodal activity and earthquakes although there is enough to hint that there is a dynamic there which is intriguing and worth a look at. I know also that it's more pronounced in major impact events, but in light of recent activity, this kind of popped out to me.
I know this is one of your favourites but you know, if there is not enough data you could get the data and prove it to your own satisfaction. I have said it before on the thread that there is evidence that asteroid impact has had this effect and there is certainly anecdotal information out there.
I don't have time to study it as I am trying to get my head round the Sun (no comments about how my head is big enough) and that is a massive subject BUT teaching you to suck eggs probably so that others can see it is a simple enough thing to do given some time.
First get yourself a list of whatever magnitude level you want to start at from the ANSS search page
For each quake calculate the antipodes
Find your latitude and longitude.
Calculate your antipodal longitude:
If your longitude > 0, (i. e. in the Eastern Hemisphere or +ve [positive]), add it to -180.
If your longitude< 0, (i. e. in the Western Hemisphere or -ve [negative]), subtract it from 180.
Your antipodal latitude is the same as your own latitude, swapping north with south or - with +
So taking the quake you posted Location 41.097°S, 44.656°E that is Latitude -41.097 which becomes Latitude 41.097, and Longitude 44.656 which is + so becomes -180+44.656 which is -135,344 or 135.244°W
On the ANSS search page you can use the delta function to get a circular search. (Note if you are not going back further than 1970 then the USGS Circular search is OK and is simpler) otherwise for the ANSS search the function goes in the additional parameters box. To save you reading all the bumf on how to use it I have shown an example here. It is delta=latitude,longitude,start radius, end radius
Setting the start radius to greater than 0 gives you a doughnut (or donut ) search.
I would probably recommend that you make the magnitude 0 to 10 and you will need to decide on what period after the date you would consider to be reasonable.
If you decide to accept this mission we look forwards to the results. This message will self destruct in 15 seconds.
source(www.emsc-csem.org...
Magnitude mb 4.6
Region CENTRAL TURKEY
Date time 2012-02-16 11:01:03.0 UTC
Location 38.65 N ; 37.46 E
Depth 3 km
Distances 81 km NW Malatya (pop 441,805 ; local time 13:01:03.5 2012-02-16) 12 km NW Darende (pop 20,388 ; local time 13:01:03.5 2012-02-16)
Just thought I would post this link here
www.wired.com...
Erik Klemetti's site. I know the main body is to do with supervolcanoes, but if you scroll down there is some ineresting posts about the recent EQ's.
@ButterCookie...Please do not go quoting me in making your point against PM. You don't know me and you certainly don't know the understanding PM and I have and the reason behind why I posted in the manner I did. I would appreciate if you would find a way of removing said quote from your post, thank you. If you have any problem with this or want to take issue with me then please U2U me and not do so on this thread.
Rainbows
Jane
edit on 16-2-2012 by angelchemuel because: add
Puterman, I am glad that you listed the chart as you did....shows some interesting stats that can be very helpful.
Here's a good question...were the 5.9 quakes off the coast of Oregon more so foreshocks or random ocean quakes?
I am going to checking info on those out in the days to come.
Thanks!
Here's a good question...were the 5.9 quakes off the coast of Oregon more so foreshocks or random ocean quakes?
I am going to checking info on those out in the days to come.
Thanks!
reply to post by ButterCookie
I am just in the process of up dating that chart to today, but in the meantime I guess I have to ask which 5.9s as there are three listed
1993-09-21T03:28:55.630Z
2002-07-09T18:40:35.630Z
2008-11-28T13:42:18.680Z
None of them could possibly be called random ocean quakes if only because they are close to or on a spreading ridge or a transform zone (or subduction zone depending on the placement) and are thus directly connected with that activity.
The first 5.9 was followed by a 6 in about the same place, however personally I would not have said that it would be reasonable to call the 5.9 a foreshock of the 7 a year later and basically too far away. The 5 in June 1994 could not be argued as fitting that bill either as it is about 4° of latitude away.
The 5.9 in July 2001 is a gain in my opinion too far away from the later 5.7 (July) followed by the 6.3 (Jan 2003). I guess a case could be put forward for the sequence starting in Dec 2004 leading eventually to the 7.2 in June 2005 being foreshocks as they are all in the same area. A (slow) rash of mag 5's appears to indicate a mag 7 later but with only 2 sets I have looked at I am not sure I would want to reach that conclusion especially as 2008 started with a 6.3 and rumbled on with 5s spread about all over the place the rest of the year.
The 5.9 in 2008 definitely does not seem to fit the pattern of the previous ones. I will report back when i have the latest data added and maybe go back a little further as well.
reply to post by PuterMan
My apologies...the one from this week ( I was thinking two because of the two California quakes)
6.0 OFF THE COAST OF OREGON43.54°N -127.38°W 10Km Deep 2012-02-15 03:31:20 UTC2012-02-14 19:31:20 LOCAL USB00080IB
My apologies...the one from this week ( I was thinking two because of the two California quakes)
6.0 OFF THE COAST OF OREGON43.54°N -127.38°W 10Km Deep 2012-02-15 03:31:20 UTC2012-02-14 19:31:20 LOCAL USB00080IB
Here is an example of what I call doom mongering.
The title is: 20 Times More Japanese Earthquakes in the 6 Months Following March 2011 than in the Previous 9 YEARS … Quake May Have “Awakened” Fukushima Fault
Take the time to read the linked PDF file which is actually entitled "Tomography of the 2011 Iwaki Earthquake (M7.0) and Fukushima nuclear power plant area"
(You can see why ATS T&C require the correct title to be quoted on breaking news)
Not such a scary title is it.
Note carefully the conclusion (I have not studied the document in detail yet)
The article at the top says "making it likely that a large earthquake will occur this year". Does the paper say this? No it does not, indeed it says the quake has already happened. Also in the body of the PDF it states that because of the Tohoku-oki quake they had a good supply of data. Nowhere in that document does it state that there were 20 times more earthquakes since March than in the whole previous 9 years.
I have not counted them but the area used to get about 3 x mag 6 a year so that would make about 18 in 9 years and maybe 2 or 3 mag 7s. 18 x 20 is 360. so it was not the mag 6s then. I can't be doing the calculation for mag 5's right now but my point is that even if their figure is correct that there were 20 times more mag 5s than in the previous 9 years so what? It was after a MAG 9 for goodness sake and the statement, in fact the whole title has nothing, other than the fault reactivated, to do with the content of the PDF linked.
I call that doom mongering - presenting misleading information (for reasons unknown - maybe to drive people to a web site for the purpose of book sales or video sales as is often the case) That is profiteering on peoples fears and is wrong. I am not saying that is the case here. It may be something as simple as blog traffic.
The main drive of the blog actually seems to be about the nuclear plant and this statement
is completely ridiculous as there has always been a 98% chance in three years as that is the average frequency of mag 7 quakes for the area, but they make it sound like something new and scary.
The title is: 20 Times More Japanese Earthquakes in the 6 Months Following March 2011 than in the Previous 9 YEARS … Quake May Have “Awakened” Fukushima Fault
We have extensively documented the fact that engineers knew that Fukushima was built in an area which was highly-susceptible to giant earthquakes, and that it would fail in a large earthquake.
Unfortunately, Pandora’s Box may now have been opened.
Specifically, Japanese scientists have published a scientific paper in European Geosciences Union’s journal Solid Earth saying that the 9.0 earthquake last March has apparently “awakened” the Fukushima earthquake fault, making it likely that a large earthquake will occur this year right near the stricken nuclear complex.
Take the time to read the linked PDF file which is actually entitled "Tomography of the 2011 Iwaki Earthquake (M7.0) and Fukushima nuclear power plant area"
(You can see why ATS T&C require the correct title to be quoted on breaking news)
Not such a scary title is it.
Note carefully the conclusion (I have not studied the document in detail yet)
This process, together with the exertion of horizontally extensional stress regime, induced by the Tohoku-oki mainshock, caused reactivation of the Idosawa normal fault, leading to the 2011 Iwaki earthquake and
its aftershocks.
The article at the top says "making it likely that a large earthquake will occur this year". Does the paper say this? No it does not, indeed it says the quake has already happened. Also in the body of the PDF it states that because of the Tohoku-oki quake they had a good supply of data. Nowhere in that document does it state that there were 20 times more earthquakes since March than in the whole previous 9 years.
I have not counted them but the area used to get about 3 x mag 6 a year so that would make about 18 in 9 years and maybe 2 or 3 mag 7s. 18 x 20 is 360. so it was not the mag 6s then. I can't be doing the calculation for mag 5's right now but my point is that even if their figure is correct that there were 20 times more mag 5s than in the previous 9 years so what? It was after a MAG 9 for goodness sake and the statement, in fact the whole title has nothing, other than the fault reactivated, to do with the content of the PDF linked.
I call that doom mongering - presenting misleading information (for reasons unknown - maybe to drive people to a web site for the purpose of book sales or video sales as is often the case) That is profiteering on peoples fears and is wrong. I am not saying that is the case here. It may be something as simple as blog traffic.
The main drive of the blog actually seems to be about the nuclear plant and this statement
Scientists say that there is a 70% chance of a magnitude 7.0 earthquake hitting Fukushima this year, and a 98% chance within the next 3 years.
is completely ridiculous as there has always been a 98% chance in three years as that is the average frequency of mag 7 quakes for the area, but they make it sound like something new and scary.
reply to post by ButterCookie
My observation as to the randomness still stands.
As far as the California 5.7 and the Oregon 6.0 (soon to be 5.8?) are concerned I don't think you would call the one a foreshock of the other purely because they are different sides of the subduction zone and thus not rupturing on the same faulting area, but connected? Yes most probably in a triggering manner.
reply to zworld re Earthquake Calculations
You have mail.
Please go to your messages to get the earthquake calculator.
You have mail.
Please go to your messages to get the earthquake calculator.
reply to post by Anmarie96
I am not sure how relevant this chart is as it is the whole region Latitudes 40°N to 50°N, and Longitudes 133°W to 123°W. My own feeling is that the JDF and Vancouver areas are probably best looked at as northern and southern ends of the potential failure zone. Anyway get your scrolling finger ready because this one is very long. 1960(Jan) to 2012(Feb) magnitude 5.0+ as monthly counts and magnitude equivalents. It is a little squashed as the two datasets looked naff on the same chart and the figures were unreadable.

More to follow as Northern and Southern ends.
I am not sure how relevant this chart is as it is the whole region Latitudes 40°N to 50°N, and Longitudes 133°W to 123°W. My own feeling is that the JDF and Vancouver areas are probably best looked at as northern and southern ends of the potential failure zone. Anyway get your scrolling finger ready because this one is very long. 1960(Jan) to 2012(Feb) magnitude 5.0+ as monthly counts and magnitude equivalents. It is a little squashed as the two datasets looked naff on the same chart and the figures were unreadable.
More to follow as Northern and Southern ends.
edit on 16/2/2012 by PuterMan because: (no reason given)
reply to post by Anmarie96
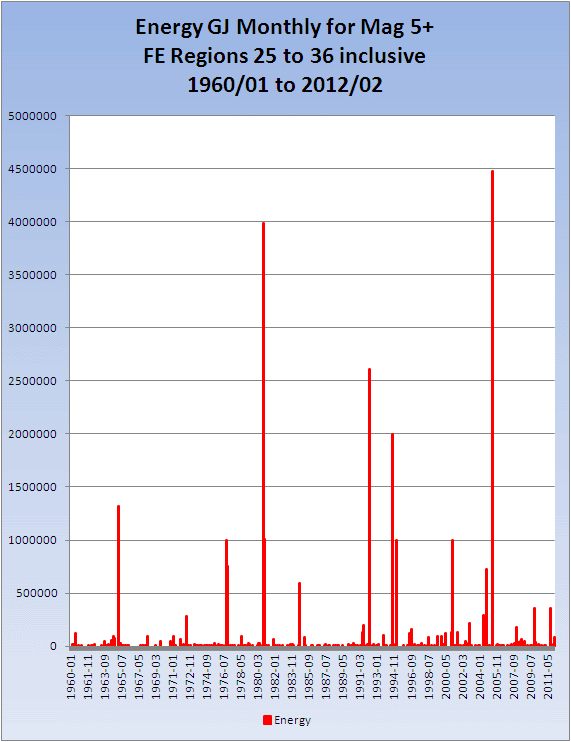
So hot off the press is the next one. Even longer than the last purely because the separation is needed to show the numbers. This is the Cascadia area split into FE geographical areas 25 to 29 and 30 to 36, very roughly in half. It is immediately obvious that there is much more activity in the Southern section. See what you think.

So hot off the press is the next one. Even longer than the last purely because the separation is needed to show the numbers. This is the Cascadia area split into FE geographical areas 25 to 29 and 30 to 36, very roughly in half. It is immediately obvious that there is much more activity in the Southern section. See what you think.
new topics
-
'Mass Casualty event' - Attack at Christmas market in Germany
Mainstream News: 5 hours ago -
Search to Resume for MH 370
Disaster Conspiracies: 7 hours ago -
Sue Gray, Sir Keir Starmer's former Chief of Staff, Nominated for Peerage
Regional Politics: 9 hours ago -
Biden Nationalizes Another 50,000+ Student Loans as He Heads for the Exit
US Political Madness: 10 hours ago
top topics
-
'Mass Casualty event' - Attack at Christmas market in Germany
Mainstream News: 5 hours ago, 22 flags -
Biden Nationalizes Another 50,000+ Student Loans as He Heads for the Exit
US Political Madness: 10 hours ago, 7 flags -
Search to Resume for MH 370
Disaster Conspiracies: 7 hours ago, 4 flags -
Sue Gray, Sir Keir Starmer's former Chief of Staff, Nominated for Peerage
Regional Politics: 9 hours ago, 3 flags
active topics
-
'Mass Casualty event' - Attack at Christmas market in Germany
Mainstream News • 58 • : WeMustCare -
Biden Nationalizes Another 50,000+ Student Loans as He Heads for the Exit
US Political Madness • 11 • : WeMustCare -
An Interesting Conversation with ChatGPT
Science & Technology • 23 • : Naftalin -
My personal experiences and understanding of orbs
Aliens and UFOs • 23 • : DaydreamerX -
US Federal Funding set to Expire December 20th. Massive CR on the way.
Mainstream News • 60 • : KrustyKrab -
Post A Funny (T&C Friendly) Pic Part IV: The LOL awakens!
General Chit Chat • 7936 • : baddmove -
Search to Resume for MH 370
Disaster Conspiracies • 4 • : theatreboy -
Drone Shooting Arrest - Walmart Involved
Mainstream News • 38 • : bluesman023 -
Covid....... Again.
Diseases and Pandemics • 33 • : annonentity -
Russias War Against Religion in Ukraine
World War Three • 55 • : Freeborn