It looks like you're using an Ad Blocker.
Please white-list or disable AboveTopSecret.com in your ad-blocking tool.
Thank you.
Some features of ATS will be disabled while you continue to use an ad-blocker.

Quake Watch 2012
page: 48share:
reply to post by PuterMan
Oh definitely noticeable in the Southern section. Good job..but uh...what does this mean?
Oh definitely noticeable in the Southern section. Good job..but uh...what does this mean?
reply to post by Anmarie96
And finally for tonight the energy split North and South. (ETA: Forgot to say no labels on the North as it makes the whole thing unreadable and a side by side is out because of the big spurt)

And finally for tonight the energy split North and South. (ETA: Forgot to say no labels on the North as it makes the whole thing unreadable and a side by side is out because of the big spurt)
edit on 16/2/2012 by PuterMan because: (no reason given)
reply to post by PuterMan
Thanks PM - very interesting and it will take my brain a little while to absorb. I will be better able search it out tomorrow on high speed. It appears a first glance, that there is a correlation of sorts with Mount St. Helens which makes perfect sense but also the activity at Yellowstone. When looking at the energy, it appears things are gearing up the last few years. I have to chew on this awhile. Thank you very much for your effort :-)
Thanks PM - very interesting and it will take my brain a little while to absorb. I will be better able search it out tomorrow on high speed. It appears a first glance, that there is a correlation of sorts with Mount St. Helens which makes perfect sense but also the activity at Yellowstone. When looking at the energy, it appears things are gearing up the last few years. I have to chew on this awhile. Thank you very much for your effort :-)
reply to post by murkraz
Just saw that. hmmm a little unusual I say.
Both of those 3.7's were downgraded to 3.5
earthquake.usgs.gov...
Just saw that. hmmm a little unusual I say.
Both of those 3.7's were downgraded to 3.5
earthquake.usgs.gov...
reply to post by PuterMan
Wow...love these visuals.
Looking at it like this makes it quite obvious that the Southern end has released a significant amount of more energy than the North. Now. Does this mean that it is slipping more and so is more likely to give, or that it has released more of the built-up strain so the North is more likely to let go all at once? Unfortunately, I think it's more likely the later.....
reply to post by westcoast
and
reply to post by MamaJ
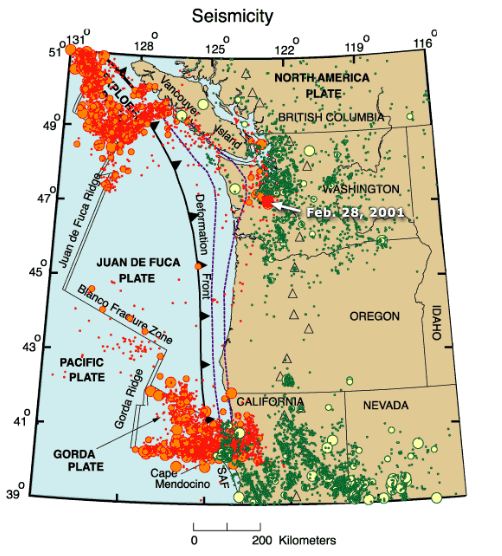
Not sure actually. There is over 1,200 miles of boundaries there around the edge of the JDF plate and about 857 miles of subduction zone. Of the spreading, transform and convergent areas about 400 miles lies in the southern area that is transform boundaries where you will most likely get quakes, and about 200 miles of transform boundaries lie in the northern half.
This, maybe coincidentally, seems to be about the ratio of energy as well. Since there is also a certain amount of see-sawing between the two my guess is that much of what we see is grinding in the transform areas being transferred backwards and forwards as the spreading areas push the plate.
The area along the subduction zone currently is only having shallow quakes ( but see my note below ). In my my humble opinion not much is going to happen there right now, but I could be wrong of course.
The deepest quakes (over 40m deep) are few and far between. I have marked them here.
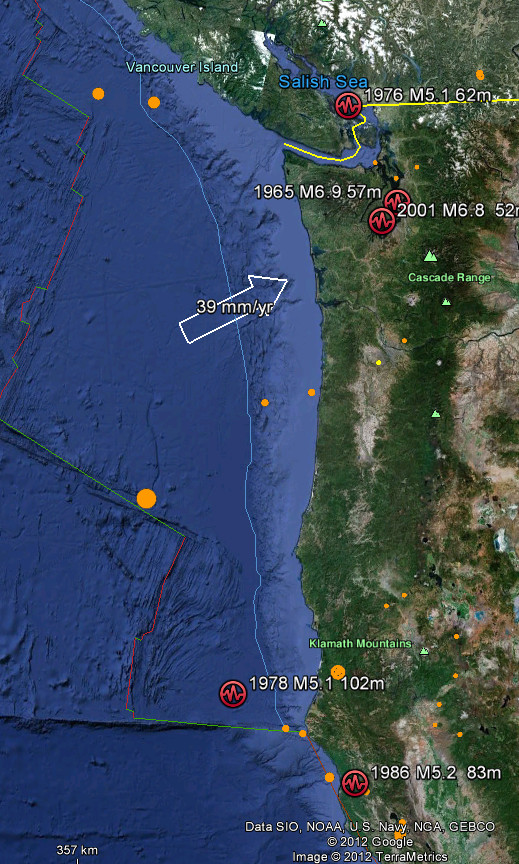
The odd thing is that the deepest are at the very southern end of the subduction zone and sort of in the wrong place if you understand what I am saying. They should be further East. The Northern ones are about right I think.
This may suggest that the most stress is building in the middle of the zone sort of opposite Portland where there as been a Mag 1.8 (I have only looked at 5+) @ 67 miles deep. The depth element needs more study, but look at the line of quakes at the same angle as the subduction arrow. There is also an arc of quakes across the top but they are all relatively shallow.
I will go down a couple of notches on the magnitudes and see if I can come up with anything.
and
reply to post by MamaJ
Not sure actually. There is over 1,200 miles of boundaries there around the edge of the JDF plate and about 857 miles of subduction zone. Of the spreading, transform and convergent areas about 400 miles lies in the southern area that is transform boundaries where you will most likely get quakes, and about 200 miles of transform boundaries lie in the northern half.
This, maybe coincidentally, seems to be about the ratio of energy as well. Since there is also a certain amount of see-sawing between the two my guess is that much of what we see is grinding in the transform areas being transferred backwards and forwards as the spreading areas push the plate.
The area along the subduction zone currently is only having shallow quakes ( but see my note below ). In my my humble opinion not much is going to happen there right now, but I could be wrong of course.
The deepest quakes (over 40m deep) are few and far between. I have marked them here.
The odd thing is that the deepest are at the very southern end of the subduction zone and sort of in the wrong place if you understand what I am saying. They should be further East. The Northern ones are about right I think.
This may suggest that the most stress is building in the middle of the zone sort of opposite Portland where there as been a Mag 1.8 (I have only looked at 5+) @ 67 miles deep. The depth element needs more study, but look at the line of quakes at the same angle as the subduction arrow. There is also an arc of quakes across the top but they are all relatively shallow.
I will go down a couple of notches on the magnitudes and see if I can come up with anything.
edit on 16/2/2012 by PuterMan because: (no reason given)
Sorry the depth thing is going to take a bit longer. I crashed the Berkeley server again, and stuffed up my own machine as well. Oops!
It was only 62000 quakes in a kmz file honest!
By the way of the 62000 quakes since about 1965 that have depths only 1046 as far as I recall before I had to abandon ship were deeper than 40 miles. Not many really.
I shall have to get the data in lumps and assemble it myself.
It was only 62000 quakes in a kmz file honest!
By the way of the 62000 quakes since about 1965 that have depths only 1046 as far as I recall before I had to abandon ship were deeper than 40 miles. Not many really.
I shall have to get the data in lumps and assemble it myself.
Originally posted by MamaJ
reply to post by PuterMan
Oh definitely noticeable in the Southern section. Good job..but uh...what does this mean?
MamaJ.
Me being autistic I think in pictures most times. And I have to convert graphs into visualizations. This is quakes over a long period of time (100 years?) in the CSZ.
It shows the pressure being exerted from all these quakes into the CSZ which is damn near void of large quakes. Both ends are at the maximum stress point. and the CSZ being what it is, a rupture at one end could travel until it releases the pressure at the other end.
It is especially true in the southern end where the quakes are a result of the northwestward moving San Andreas crunching the Gorda against the JDF and into the N American. These large quakes have only placed greater stress on two key areas, the area where the recent series was, the interface between Gorda and JDF; and the area where Gorda is locked on it's northern edge.
edit on 16-2-2012 by zworld because: (no reason given)
oh oh listen
Franklin Fault in Vallejo
two 3.5 mags one today one yesterday
Local news has a story on now
Said this could be the first significant activity on this fault in 11,000 years
Right by the Carcinas Bridge You can see the fault, they showed it, goes along the shoreline next to the bridge, the two quakes were right under the bluff. The fault line runs directly with the Carcinas Strait Because of the sediments it was felt over a wide area. I didn't feel it.
It could pair up with adjacent faults (Hayward-Rogers and Concord Green Valley faults) and let loose a big one.
According to the USGS lady they interviewed she said she expects seismologists to begin digging trenches alongside Franklin to study it's history.
John Fowler had the story and as he signed off he said, be prepared for more quakes along this area.
BG reporting from Berzerkeley
I took all this info from the story, had to replay a few times to get it right.
BG out
reply to post by zworld
Which sort of says what I said but so much more fluently!
Just below that 2001 quake, opposite Portland is where it will go when it does I think.
Which sort of says what I said but so much more fluently!
Just below that 2001 quake, opposite Portland is where it will go when it does I think.
Originally posted by PuterMan
reply to post by zworld
Which sort of says what I said but so much more fluently!
Thats cause a picture is worth a thousand words. But check this one out. PNSN has just made yesterdays 5.9 back into two quakes like they did for a few minutes yesterday. Now we have a 5.9 and a 6.0 a minute apart. I wonder if this is why waveforms and stuff didnt seem right.
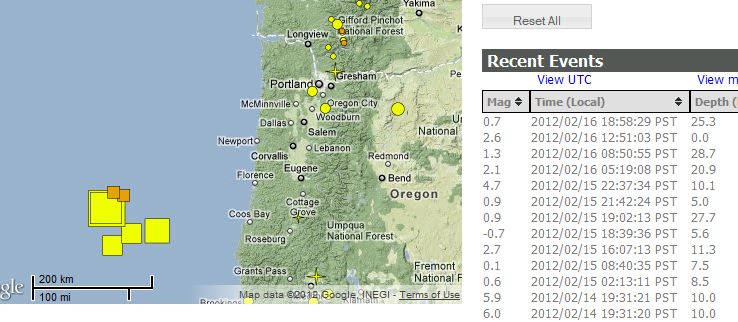
Wait a minute (no pun intended). Theyre one second apart. How does that work. I do not understand.
edit on 16-2-2012 by zworld because: (no
reason given)
reply to post by zworld
Different Networks data
Magnitude: 5.9
Time(UTC): 2012/02/15 03:31:21
Time(Local): 2012/02/14 19:31:21 PST
Depth: 10.0Km (6.2miles)
Event Id: b00080ib
Network: us
Magnitude: 6.0
Time(UTC): 2012/02/15 03:31:20
Time(Local): 2012/02/14 19:31:20 PST
Depth: 10.0Km (6.2miles)
Event Id: 71735596
Network: nc
Evènement sismique du 17/02/2012 à 01:57:30.9 UTC
Temps local : 17/02/2012 à 12:57:30
localisé à Vanuatu Islands
Magnitude : M 5.3
Profondeur : 10 km
VGOW
ND.LIFNC..BHE Lifou, Loyalty Islands, New Caledonia, New Caledonia Broadband Seismic Network
ND.ONTNC..BHE Ouen Toro, Noumea, New Caledonia, New Caledonia Broadband Seismic Network
LISS SNZO
______________________________________________________________________________
While I was looking at the Vanuatu site I went over to New Caledonia www.seisme.nc...
might be worth adding to the list of Networks
______________________________________________________________________________
It had this quake in NZ , before its even showing on Geonet, which at the moment terminates data at 05:55:29
seisan.ird.nc...
North Island, New Zealand 2012-02-17 07:54:34 UTC MLv 4.0 10 km
Latitude: 40.92 °S
Longitude: 175.59 °E
Depth: 10 km
Phase count: 15
RMS residual: 0.71
Agency: IRD
Event Id: ird2012dimh
Distance to nearest cities:
6 kms of Masterton
42 kms of Levin
50 kms of Kapiti
53 kms of Upper Hutt
63 kms of Lower Hutt
63 kms of Palmerston North
so much for the new Geonet Rapid
and there it is on Mangatainoka Drum and SNZO BHZ too,
edit on 17-2-2012 by muzzy
because: made a mess of the links
ah ha here it is 40 minutes later
www.geonet.org.nz...
didn't feel it here, but one report from the town north of us MM4 (Waikanae) and one from the next village south MM4 (Raumati South) www.geonet.org.nz...
*siesmos on this post will move on in 24hrs for Geonet and LISS and expire in 17 days for the BUD ones
edit on 17-2-2012 by muzzy because: (no
reason given)
reply to post by muzzy
Neat site that Caledonia site. Direct access to the seismic data using seisan software to get the seed data. Yummy. I'm going to have a play with that - and it is realtime too it seems.
I wish more did that. on more seismos.
Neat site that Caledonia site. Direct access to the seismic data using seisan software to get the seed data. Yummy. I'm going to have a play with that - and it is realtime too it seems.
I wish more did that. on more seismos.
reply to post by zworld
And a sound is worth a thousand words as well sometimes. I concur with the double quake.
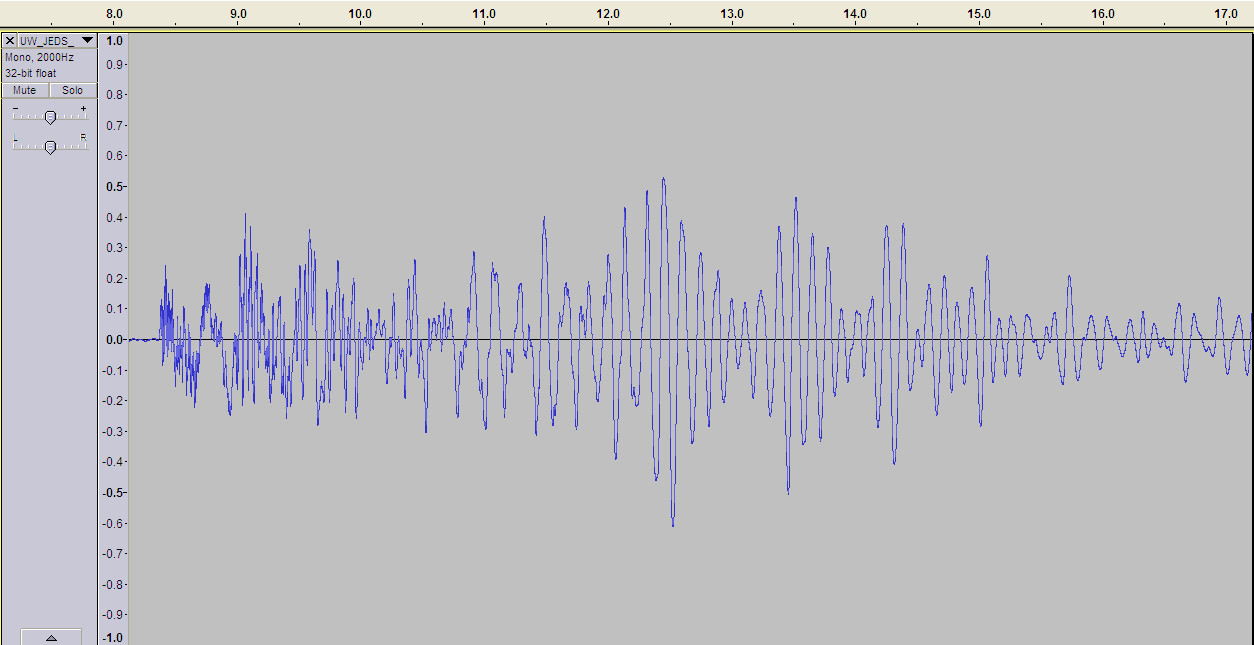
UW.JEDS.Oregon-20120215.WAV
You will need to turn the treble up to hear the double thump - no not the obvious one. The first bump has the characteristic second immediately after it, the typical p/s double hit on a nearby quake (this is UW.JEDS BHE channel by the way) The set has a hollow tone as well which is possible because the second quake is acting as a slight echo effect.
The waveform is heavy at the start and has possibly more modulation, but I don't think i would immediately recognise that as a double quake.
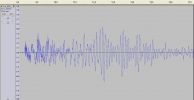
The spectrum however is a different story. Clear on this unprocessed version.
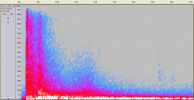
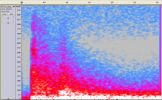
On this one I have low pass filtered for 6 Hz and the pumped up the DB. Easily seen as a double on this.
And a sound is worth a thousand words as well sometimes. I concur with the double quake.
UW.JEDS.Oregon-20120215.WAV
You will need to turn the treble up to hear the double thump - no not the obvious one. The first bump has the characteristic second immediately after it, the typical p/s double hit on a nearby quake (this is UW.JEDS BHE channel by the way) The set has a hollow tone as well which is possible because the second quake is acting as a slight echo effect.
The waveform is heavy at the start and has possibly more modulation, but I don't think i would immediately recognise that as a double quake.
The spectrum however is a different story. Clear on this unprocessed version.

On this one I have low pass filtered for 6 Hz and the pumped up the DB. Easily seen as a double on this.

WOW! Thanks!! When I saw the graph I was thinking the same thing...like a see saw. I even got a sense that if another big one were to occur it may
possibly do so in the middle and buckle. Possibly even off shore...who knows, I know I don't . I am trying my best to keep up with all the mumbo
jumbo jargon but the graphs and then ya'll explaining it really does make more sense to me.
Thanks for all you quake experts do...you are soooooooo appreciated!!!!
ETA: So....was there one or two quakes then? According to your graphs above PM it sounds like you are saying one right after the other??
Thanks for all you quake experts do...you are soooooooo appreciated!!!!
ETA: So....was there one or two quakes then? According to your graphs above PM it sounds like you are saying one right after the other??
edit
on 17-2-2012 by MamaJ because: (no reason given)
reply to post by angelchemuel
Yes, but I knowhowhow...(cough)..anyway,nice try.
the understanding PM and I have and the reason behind why I posted in the manner I did.
Originally posted by PuterMan
reply to post by zworld
And a sound is worth a thousand words as well sometimes. I concur with the double quake.
UW.JEDS.Oregon-20120215.WAV
Amazing PM. Im blown away. Never heard of two separate quakes hitting the same place at the same time. PNSN is still going with that concept this AM so Im going to have to agree with you and them, though it goes against everything I thought I understood about EQs, and Im having trouble picturing it.
Back to the drawing board.
Magnitude mb 5.5
Region WESTERN XIZANG
Date time 2012-02-17 15:44:21.0 UTC
Location 32.44 N ; 82.86 E
Depth 10 km
Distances 459 km NE Rudrapur (pop 101,560 ; local time 21:14:21.4 2012-02-17)
362 km NE Dashrathchand (pop 18,317 ; local time 21:14:21.4 2012-02-17)
359 km N Jumla (pop 9,073 ; local time 21:29:21.4 2012-02-17)
EMSC
Magnitude mb 4.5
Region JAN MAYEN ISLAND REGION
Date time 2012-02-17 16:08:55.9 UTC
Location 71.83 N ; 0.69 W
Depth 40 km
Distances 1040 km NW Trondheim (pop 147,139 ; local time 17:08:55.9 2012-02-17)
723 km NW Harstad (pop 19,433 ; local time 17:08:55.9 2012-02-17)
666 km NW Straume (pop 291 ; local time 17:08:55.9 2012-02-17)
EMSC
new topics
-
Swedish Minister for Gender Equality is Seeking Treatment for Phobia of Bananas
Other Current Events: 5 hours ago -
Satanic ‘Little Season’ of Deception.. Awaken to the Handiwork of the Creator.
ATS Skunk Works: 6 hours ago -
USA-BIDEN and CHINA-Xi Agree Not To Let Artificial Intelligence Decide Nuclear Weapons Use.
World War Three: 6 hours ago -
The mysterious death of Aileen Conway
General Chit Chat: 9 hours ago
top topics
-
Does the Trump win mean No More Taylor Swift??
Politicians & People: 16 hours ago, 12 flags -
The mysterious death of Aileen Conway
General Chit Chat: 9 hours ago, 6 flags -
USA-BIDEN and CHINA-Xi Agree Not To Let Artificial Intelligence Decide Nuclear Weapons Use.
World War Three: 6 hours ago, 3 flags -
Satanic ‘Little Season’ of Deception.. Awaken to the Handiwork of the Creator.
ATS Skunk Works: 6 hours ago, 3 flags -
Swedish Minister for Gender Equality is Seeking Treatment for Phobia of Bananas
Other Current Events: 5 hours ago, 3 flags -
Half-Life 2 is 20 Years Old - its Also Free on Steam until the 18th
Video Games: 13 hours ago, 1 flags
active topics
-
I’m Looking for Information on the Light We See at Death.
The Gray Area • 62 • : whereislogic -
President-elect TRUMP Picks MATT GAETZ for his ATTORNEY GENERAL - High Level PANIC Ensues.
2024 Elections • 92 • : EyeoftheHurricane -
On Nov. 5th 2024 - AMERICANS Prevented the Complete Destruction of America from Within.
2024 Elections • 157 • : WeMustCare -
Candidate TRUMP at MADISON SQUARE GARDEN - Sold Out in Just 3 Hours - Sun Oct 27th 2024.
2024 Elections • 51 • : WeMustCare -
Does the Trump win mean No More Taylor Swift??
Politicians & People • 50 • : bluesman023 -
The Trump effect 6 days after 2024 election
2024 Elections • 150 • : cherokeetroy -
TODAY IS A HUGE ELECTION DAY FOR AMERICA - November 5th 2024 - Reports from Around The Nation.
2024 Elections • 750 • : WeMustCare -
President-Elect DONALD TRUMP's 2nd-Term Administration Takes Shape.
Political Ideology • 213 • : WeMustCare -
Satanic ‘Little Season’ of Deception.. Awaken to the Handiwork of the Creator.
ATS Skunk Works • 4 • : NorthOS -
-@TH3WH17ERABB17- -Q- ---TIME TO SHOW THE WORLD--- -Part- --44--
Dissecting Disinformation • 3284 • : 777Vader