It looks like you're using an Ad Blocker.
Please white-list or disable AboveTopSecret.com in your ad-blocking tool.
Thank you.
Some features of ATS will be disabled while you continue to use an ad-blocker.
share:
a reply to: dianajune
Despite of being a strong critic of USelessGS, I wouldn't go by the results from a European Agency (EMSC) for a USA quake.
Better to go with the locals.
As you see on the comparative images below, the quakes are not on top of each other (according to USGS).
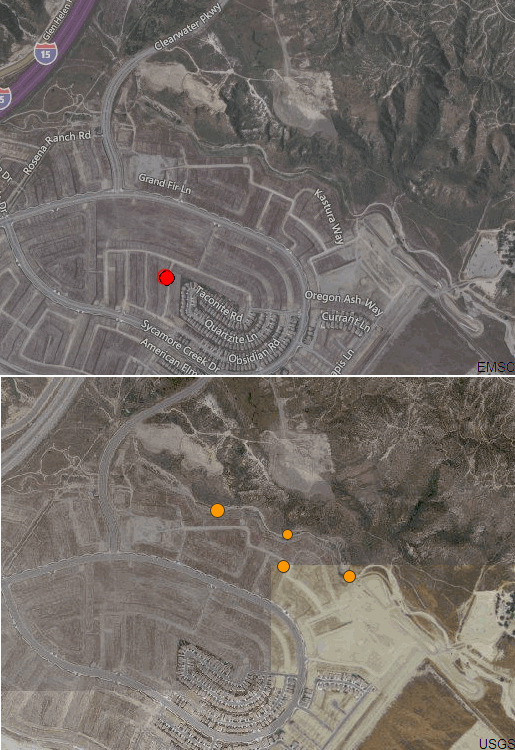
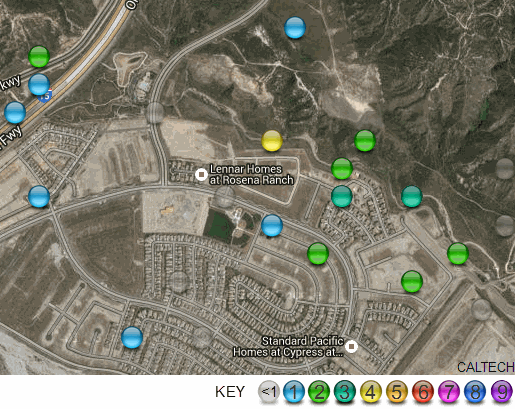
Better still, for this series, follow the CaliTech list
scedc.caltech.edu...
there are 23 events, in this series, at this time, so far
Despite of being a strong critic of USelessGS, I wouldn't go by the results from a European Agency (EMSC) for a USA quake.
Better to go with the locals.
As you see on the comparative images below, the quakes are not on top of each other (according to USGS).

Better still, for this series, follow the CaliTech list
scedc.caltech.edu...
there are 23 events, in this series, at this time, so far

edit on 1200000036236215 by muzzy because: (no reason given)
meanwhile.....
taking an indoor break from the blazing Sun (for 6 days!!) here, I was looking at Japans Hi-net Hypocenter maps
select Regional Maps: Tohoku and Kanto Regions and last 24 hrs
and/or Prefecture Maps: select Ibaraki Pref.
The mountain range just north of Hitachi in Northern Ibaraki Pref. has been quite busy (small quakes)
I noticed this Mt. range started to show activity after the M9.0 of 2011. It hadn't seen much before.
I thought I would go back and check that out.
Whoa!
The last update I did for Japan March 2011 was in July 2015, and that is what shows on the maps on :japanquakes1:2011 now.
The folks at NIED must constantly be going over their data over and over,
the latest update (today) shows quite a different story, particularly the number of M5's and M6's
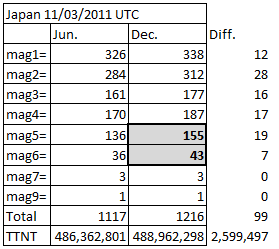
We have a bit of rain tomorrow, so I might stay in and go over March again and update the maps
taking an indoor break from the blazing Sun (for 6 days!!) here, I was looking at Japans Hi-net Hypocenter maps
select Regional Maps: Tohoku and Kanto Regions and last 24 hrs
and/or Prefecture Maps: select Ibaraki Pref.
The mountain range just north of Hitachi in Northern Ibaraki Pref. has been quite busy (small quakes)
I noticed this Mt. range started to show activity after the M9.0 of 2011. It hadn't seen much before.
I thought I would go back and check that out.
Whoa!
The last update I did for Japan March 2011 was in July 2015, and that is what shows on the maps on :japanquakes1:2011 now.
The folks at NIED must constantly be going over their data over and over,
the latest update (today) shows quite a different story, particularly the number of M5's and M6's

We have a bit of rain tomorrow, so I might stay in and go over March again and update the maps
The little sequence of quakes around Devore, CA, USA seems to have set off a few more elsewhere.
Since the 4.4 at 17:48 local time, there has been more than 25 quakes at the same general locale, and at least 10 small ones spread around the area, too.
San Jacinto Fault Zone seems to be what's contributing to things since Elsinore Fault Zone and San Andreas are relatively quiet towards the south over the past 24 hours.
As I'm writing this, most every quake north of Eastvale has occurred after the 4.4 in Devore.
I wasn't going to write, but I'm a Canadian and we don't really get many at all. So, 4.8M off Vancouver Island, British Columbia.
Honestly, North American in general is up to something. I've been going on about the Northern Nevada earthquakes for awhile, so I'll skip over the fact that they are active again and get to the new stuff. Just to the southwest, a few days ago, there was a new flurry of earthquakes. In isolation, I would ignore it as part of the same thing. Then several other earthquakes hit in a more eastward pattern.
Oh, here's the B.C. Quake.
www.cbc.ca...
Here I go, I really didn't want to offer my opinion on California, but here is it. On our regular USGS map you'll notice the faultline in California near the Salton Sea, it's incomplete. Of course this fault line is the San Andreas. But here's my guess, the real San Andreas is slightly more to the west.
a reply to: paradoxious
USGS map with Faults shows this area is a junction between 4 faults
Sierra Madre, Cucaminga section
San Jacinto, which with multiple segements is about 3km wide
San Andreas
Waterman Canyon
a perfect place for earthquakes
also note this is at the confluence of two rivers, centered on a new sub division (not sure of the date of the satellite maps) I wonder what new storm water runoff alterations to the natural norm may have to play in this?
I note USGS seem to have caught up with CalTech, about the same number of events now, 70-72ish
also between San Bernadino and Desert Hot Springs (N of Palm Springs) the San Andreas splits into 2 lines also 3km apart,
as I have noticed in New Zealand often a series of quakes will not exactly fall ON the line on the map
many Faults appear to be quite wide ( up to 3km?), rather than a slim line on the map.
I don't see this as a Swarm building to something bigger,
it is just a M4.4 and aftershocks,
the quantity of aftershocks due to the fragile nature of the fault junction
Caltech have reviewed their data and moved the 4's and 3's to the north into Mormon Batalion Mountain

my GPS Visualiser USGS Topo map shows the area of events as Muscupiabe Grant, which Wiki says comes from "Rancho Muscupiabe was a 30,145-acre (121.99 km2) Mexican land grant in present day San Bernardino County, California given to Michael C. White on April 29, 1843, by Governor Manuel Micheltorena. The name comes from the Serrano word muscupiabit, meaning "place of little pines." The rancho was adjacent to Cajon Pass."

"Muscupiabe Grant" sounds a lot more Californian then "xx km SW of Devore"
So lets call this the "Dec 2015 Muscupiabe Grant M4.4" eh?
Geez this is all a bit of an overreaction don't you think?
M4.4!
USGS map with Faults shows this area is a junction between 4 faults
Sierra Madre, Cucaminga section
San Jacinto, which with multiple segements is about 3km wide
San Andreas
Waterman Canyon
a perfect place for earthquakes
also note this is at the confluence of two rivers, centered on a new sub division (not sure of the date of the satellite maps) I wonder what new storm water runoff alterations to the natural norm may have to play in this?
I note USGS seem to have caught up with CalTech, about the same number of events now, 70-72ish
also between San Bernadino and Desert Hot Springs (N of Palm Springs) the San Andreas splits into 2 lines also 3km apart,
as I have noticed in New Zealand often a series of quakes will not exactly fall ON the line on the map
many Faults appear to be quite wide ( up to 3km?), rather than a slim line on the map.
I don't see this as a Swarm building to something bigger,
it is just a M4.4 and aftershocks,
the quantity of aftershocks due to the fragile nature of the fault junction
edit on 1200000036336315 by muzzy because: (no reason given)
Caltech have reviewed their data and moved the 4's and 3's to the north into Mormon Batalion Mountain

my GPS Visualiser USGS Topo map shows the area of events as Muscupiabe Grant, which Wiki says comes from "Rancho Muscupiabe was a 30,145-acre (121.99 km2) Mexican land grant in present day San Bernardino County, California given to Michael C. White on April 29, 1843, by Governor Manuel Micheltorena. The name comes from the Serrano word muscupiabit, meaning "place of little pines." The rancho was adjacent to Cajon Pass."

"Muscupiabe Grant" sounds a lot more Californian then "xx km SW of Devore"
So lets call this the "Dec 2015 Muscupiabe Grant M4.4" eh?
Geez this is all a bit of an overreaction don't you think?
M4.4!
edit on 1200000036336315 by muzzy because: (no reason given)
I'm hearing there have been no aftershocks to the Victoria/Vancouver quake. One, is this correct and two, is it a reason for concern?
Every time there's a quake any bigger than say a 3.5 in California people get nervous. In fact, if nothing happens for a period of time people get
nervous. I too noted the recent lull and wondered if it meant a build up was taking place.
The reality is that there is no proven science to much of this. There are people who have dedicated their entire professional careers to this science, using decades of research to come to their conclusions, so there is absolutely no way a bunch of conspiracy theorists on a site like ATS can come up with some kind of scenario for predicting what's going to happen.
If the brightest minds in Geological study have no idea when a "big one" is going to hit, no one here can predict it either.
The only thing anyone here can do is speculate about the patterns, go on their gut feeling, and prepare for the inevitable. It's fun and interesting, but lets not kid ourselves and pretend we have any kind of knowledge in comparison to the real professionals.
We know it's going to happen, and we know it's going to be a massively devastating quake when it arrives. It's almost meaningless whether it happens in ten minutes or ten years - people have had plenty of warning.
a reply to: AlexanderM
Actually I have read that same info as you. NO aftershocks (but initial moderate quakes reported as deep and under(?) the "locked" CSZ.) I keep checking (here) to read the opinions of our ATS experts (as they give the thorough explanation).
Fingers crossed it was just a hiccup.
Actually I have read that same info as you. NO aftershocks (but initial moderate quakes reported as deep and under(?) the "locked" CSZ.) I keep checking (here) to read the opinions of our ATS experts (as they give the thorough explanation).
Fingers crossed it was just a hiccup.
originally posted by: AlexanderM
I'm hearing there have been no aftershocks to the Victoria/Vancouver quake. One, is this correct and two, is it a reason for concern?
I've been looking and can't find any "aftershocks". The Canadian site lists none, and neither does anyone else. I pulled up the online waveforms and they look quiet. Sorry, I only scanned but the last person to comment stated the important fact, stickiness. Faults in the neck of the woods are weird. They're either locked solid, or they are quietly, and constantly moving with quiet earthquakes.
So, take your pick as to figuring out the lack of anything before and after. Maybe, no preshock, or afterschock.
I'll watch the Canadaian squiggly lines but at the moment they are quiet.
earthquakescanada.nrcan.gc.ca...
earthquakescanada.nrcan.gc.ca...
I kid you not, the second I went back to look at the webicorder waveforms the stupid thing broke. I hope it's temporary. I finally reinstalled GEE, but I can't remember where to find TrueAmericans guide for stupid people like me to follow to pick stations. I'm lazy and get frustrated easily. If someone can guide me in that lead me there.
Now it's working again
edit on 30-12-2015 by ericblair4891 because: (no reason given)
a reply to: muzzy
I was just making an observation. They all seem related to San Jacinto Fault Zone since they're all centered roughly along it. And I understand that faults usually are much wider than the little lines they draw on the maps. The area is still popping off, with 3 quakes above 1 in the preceding hour, 12:00-13:00 PST
, and total of 80 in the past 24 hours.
The "rivers" in the area are more akin to wash / streams than anything. The area south is generally flat with a slight decline in elevation towards the Santa Ana River.
I'm located a bit farther south in the Elsinore / Temecula area adjacent to the Elsinore Fault Zone. It bothers me that San Jacinto seems to be making noises but Elsinore fault zone has been quiet for a while along the 50+ mile stretch from Los Angeles to south of Temecula, and San Andreas seems a bit calm as of late too.
edit on 30-12-2015 by paradoxious because: (no reason given)
a reply to: paradoxious
And I was agreeing with you about which Fault it might be.
Being a local you would know more of what might be in store (or not).
I try to keep away from the US events, there are plenty of "experts" out there throwing out theories
My observations are from a distance, sort of like I can see the whole forest, not just the trees.
A lot of what I said was for the benefit of non Californians who might not know the area.
Devore looks like a road junction and maybe a Mall there, not much else.
originally posted by: Rocker2013
The reality is that there is no proven science to much of this. There are people who have dedicated their entire professional careers to this science, using decades of research to come to their conclusions, so there is absolutely no way a bunch of conspiracy theorists on a site like ATS can come up with some kind of scenario for predicting what's going to happen.
Any ATS theories are just as legitimate as those of USGS.
What have they come up with? nothing more than I can do on my laptop in NZ, gather a bunch of historical data and make a map.
Where is their timeline graph of this series to compare to other timeline maps of similar sized historical quakes on these same faults to be able to compare and perhaps suggest a scenerio or two?
I haven't seen those.
I agree the big ones tend to pop out of nowhere, in a place you weren't looking at before.
more stuff on San Ramon Swarm, further to: muzzy
just seen this when looking on the Berkeley Seismo Blog to see if they had anything on this latest Muscupiabe Grant 4.4 aftershock series
prelude to the big one
from Berkeley Seismological Lab 25/10/2015
from that page;
just seen this when looking on the Berkeley Seismo Blog to see if they had anything on this latest Muscupiabe Grant 4.4 aftershock series
prelude to the big one
from Berkeley Seismological Lab 25/10/2015
from that page;
To say it very clearly: Earthquake swarms are not at all an indicator that something bigger is about to come. Too many times such swarms have happened without culminating in a big, destructive quake.
edit on 1200000036336315 by muzzy because: (no reason given)
a reply to: muzzy
Caltech now have 51 events in this series
I have deleted the previous maps, I made a mistake in sorting the columns of data yesterday and the wrong icons got added for the wrong magnitudes.
the first map I did was correct on this post
the latest map (USFS+relief)
rightclickviewimageforfullsize
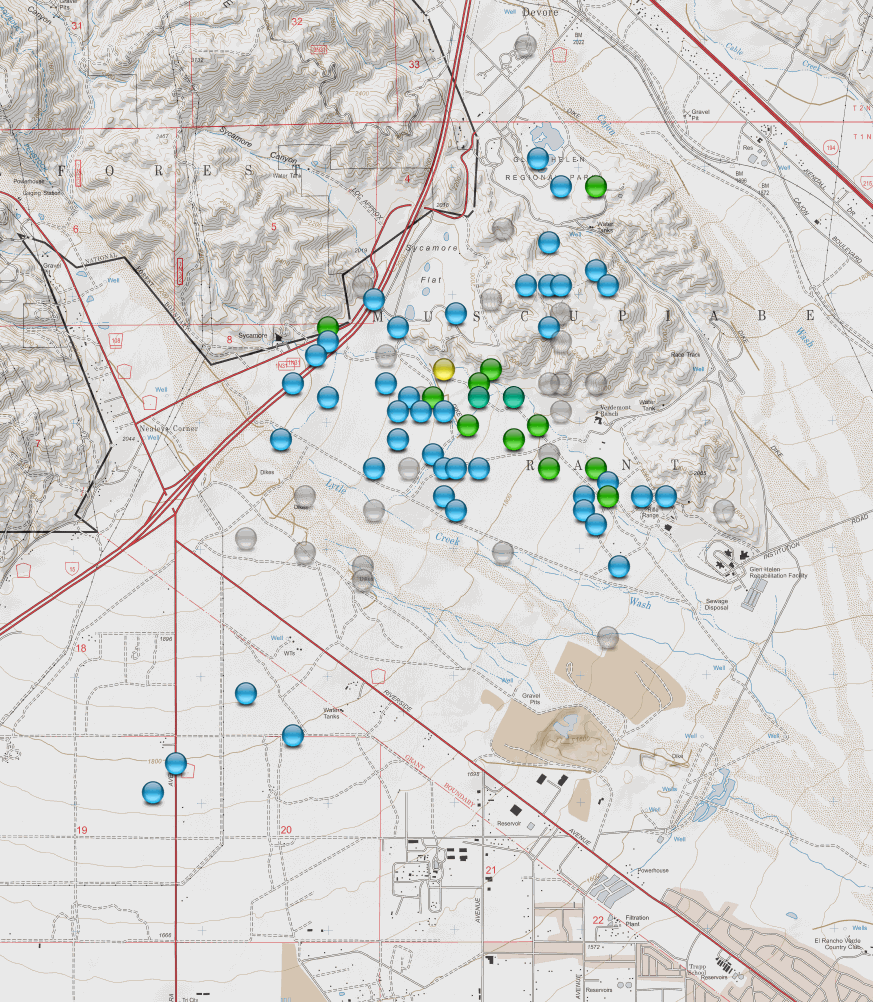
here is a timeline map of it so far
rightclickviewimageforfullsize
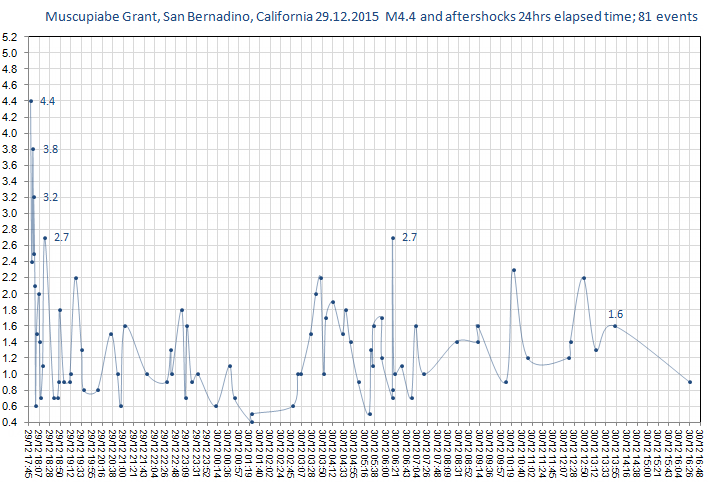
the last Los Angeles area quake I followed was the La Habra 5.1 of 29/03/2014 paradoxious will recall that one it was on the Elsinore Fault Zone
bigger quake, but a similar aftershock deterioration as the Muscupiabe Grant 4.4, with similar spikes (taking into account the mainshock size difference) .
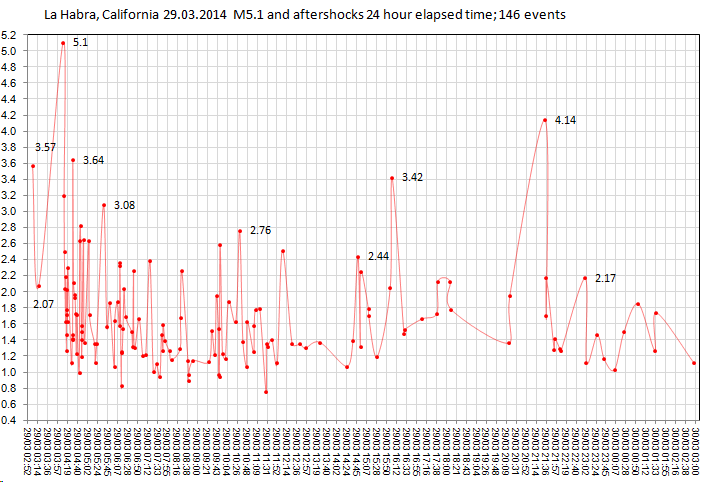
The main difference at this stage is the missing aftershock at the 20hour mark, one magnitude less than the mainshock i.e that would be a 3.5ish.
here I have overlaid the Muscupiabe Grant 4.4 graph (blue) over the La Habra 5.1 graph(red)
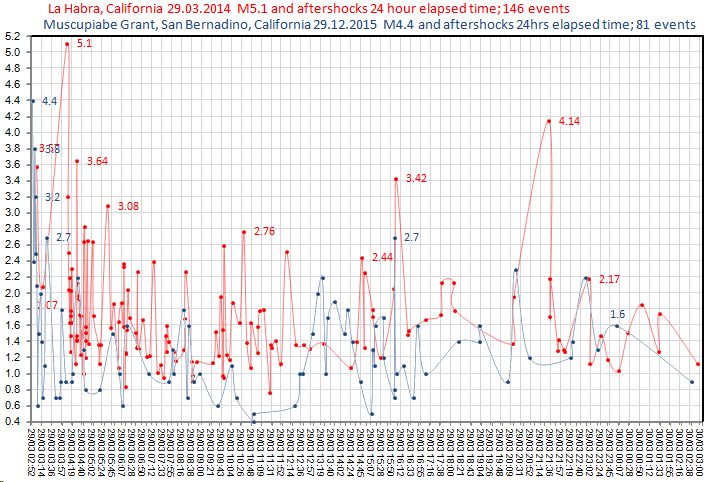
OK I know this is comparing only one quake, bit the similarities are startling in the aftershock pattern
Caltech now have 51 events in this series
I have deleted the previous maps, I made a mistake in sorting the columns of data yesterday and the wrong icons got added for the wrong magnitudes.
the first map I did was correct on this post
the latest map (USFS+relief)
rightclickviewimageforfullsize

here is a timeline map of it so far
rightclickviewimageforfullsize

edit on 1200000036336315 by muzzy because: (no reason given)
the last Los Angeles area quake I followed was the La Habra 5.1 of 29/03/2014 paradoxious will recall that one it was on the Elsinore Fault Zone
bigger quake, but a similar aftershock deterioration as the Muscupiabe Grant 4.4, with similar spikes (taking into account the mainshock size difference) .

The main difference at this stage is the missing aftershock at the 20hour mark, one magnitude less than the mainshock i.e that would be a 3.5ish.
here I have overlaid the Muscupiabe Grant 4.4 graph (blue) over the La Habra 5.1 graph(red)

OK I know this is comparing only one quake, bit the similarities are startling in the aftershock pattern
edit on 1200000036336315 by muzzy
because: (no reason given)
Another thing about the Devore area is that the railroad tracks through there carry between 100-150 freight trains per day: it's a very important
route.
Oh, and the 'flat' area near the 4.4 is home to what used to be called Glen Helen Pavilion which is a large amphitheater with a 65000 seat capacity and was financed by Steve Wozniak to host the "US Festivals" in '82-'83.
Oh, and the 'flat' area near the 4.4 is home to what used to be called Glen Helen Pavilion which is a large amphitheater with a 65000 seat capacity and was financed by Steve Wozniak to host the "US Festivals" in '82-'83.
a reply to: paradoxious
Yeah? is that the big round building on the north side of the mt?
maps calls it the San Manuel Amphitheater?
Yeah? is that the big round building on the north side of the mt?
maps calls it the San Manuel Amphitheater?
alteration to graph on: muzzy
Damn the time limit on posts, its no where near 4 hours since I posted that.
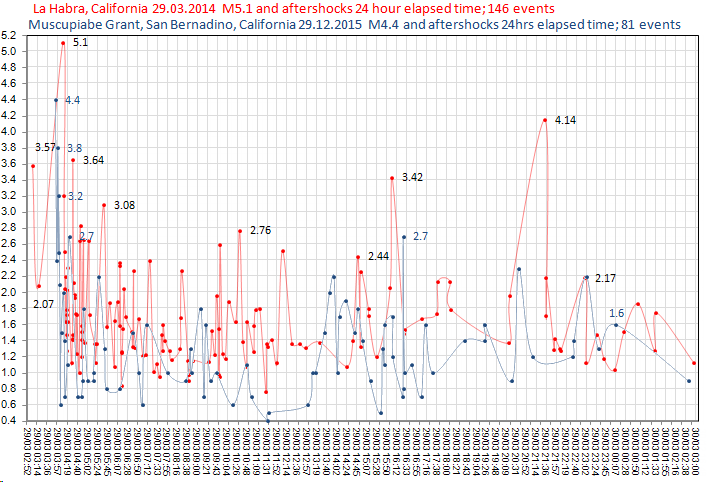
I altered the 24 hr graph with the overlay of the two comparative quakes to take into account the 2 foreshocks of the La Habra, which shifted it out of kilter with our 2015 series timeline
To me the pattern is even more similar now.
and just to be sure there are no surprises, I have taken the La Habra out to 30 days to see what may be in store after the 4.4 ........... not much.
(the narrow grey area is the graph above, i.e. the first day)
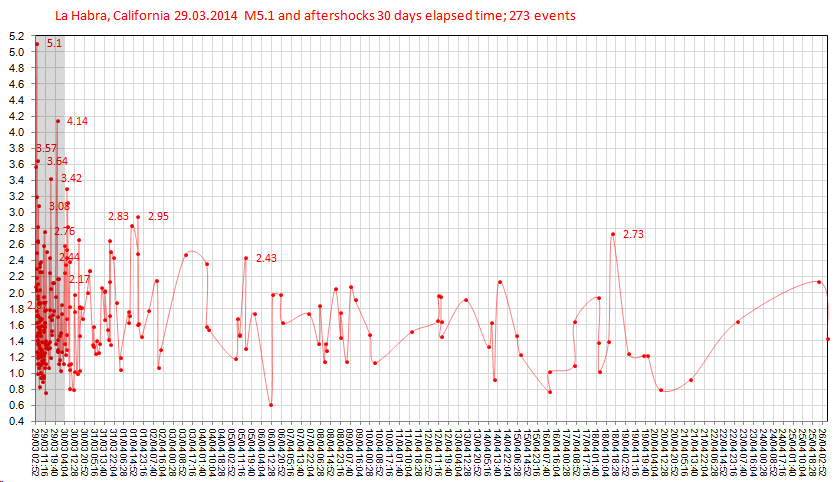
may see a 3.5 though at some stage in the next few days.
Well that's me for 2015 (NZDT), unless something major happens in the next 5.5hrs.
On the last day I learned that when you delete uploaded images from your ATS Folder, they still show in the posts!
And here was I worried for the last few years that I would use up too much ATS data storage.
Happy New Year everyone. Have a safe one.
Damn the time limit on posts, its no where near 4 hours since I posted that.
I altered the 24 hr graph with the overlay of the two comparative quakes to take into account the 2 foreshocks of the La Habra, which shifted it out of kilter with our 2015 series timeline
To me the pattern is even more similar now.

and just to be sure there are no surprises, I have taken the La Habra out to 30 days to see what may be in store after the 4.4 ........... not much.
(the narrow grey area is the graph above, i.e. the first day)

may see a 3.5 though at some stage in the next few days.
Well that's me for 2015 (NZDT), unless something major happens in the next 5.5hrs.
On the last day I learned that when you delete uploaded images from your ATS Folder, they still show in the posts!
And here was I worried for the last few years that I would use up too much ATS data storage.
Happy New Year everyone. Have a safe one.
edit on 1200000036336315 by muzzy because: (no reason given)
originally posted by: muzzy
a reply to: dianajune
Despite of being a strong critic of USelessGS, I wouldn't go by the results from a European Agency (EMSC) for a USA quake.
Better to go with the locals.
As you see on the comparative images below, the quakes are not on top of each other (according to USGS).
Better still, for this series, follow the CaliTech list
scedc.caltech.edu...
there are 23 events, in this series, at this time, so far
Thanks for the link! I've got it bookmarked. If it weren't for the info, I wouldn't have known that the quakes weren't literally on top of each other. I thought it was odd they occurred at the same exact depth, latitude and longitude!
Not finished with 2015 yet .........
So busy looking at California yesterday missed one right at my back door.....
Thats 2 close by quakes I haven't felt since moving to our new house. I believe it may be due to the foundations, we have a concrete pad foundation versus the previous house having wooden piles.
I can understand the 5.1, being so deep, but 1094 people did report it as being felt.
the other one I didn't feel was a 3.8 even closer, 4 days ago
So busy looking at California yesterday missed one right at my back door.....
Public ID 2015p983316
Universal Time December 30 2015, 19:50:50
NZ Daylight Time Thu, Dec 31 2015, 8:50:50 am
Depth 110 km
Magnitude 5.1
Location 50 km north-west of French Pass
Latitude, Longitude -40.54, 173.51
www.geonet.org.nz...
Thats 2 close by quakes I haven't felt since moving to our new house. I believe it may be due to the foundations, we have a concrete pad foundation versus the previous house having wooden piles.
I can understand the 5.1, being so deep, but 1094 people did report it as being felt.
the other one I didn't feel was a 3.8 even closer, 4 days ago
Public ID 2015p974861
Universal Time December 27 2015, 16:47:08
NZ Daylight Time Mon, Dec 28 2015, 5:47:08 am
Depth 48 km
Magnitude 3.8
Location 30 km north-west of Paraparaumu
Latitude, Longitude -40.69, 174.79
www.geonet.org.nz...
new topics
-
My personal experiences and understanding of orbs
Aliens and UFOs: 7 hours ago -
Matt Gaetz ready to go global thermonuclear
US Political Madness: 8 hours ago -
Research paper about plasmoids specifically calls out missing MH370 flight
General Conspiracies: 9 hours ago -
NJ Drones just another Psy-Op
Dissecting Disinformation: 10 hours ago
top topics
-
Matt Gaetz ready to go global thermonuclear
US Political Madness: 8 hours ago, 14 flags -
Covid....... Again.
Diseases and Pandemics: 15 hours ago, 12 flags -
Smartest Man in the World Tells His Theory About What Happens At Death
Philosophy and Metaphysics: 13 hours ago, 11 flags -
US Federal Funding set to Expire December 20th. Massive CR on the way.
Mainstream News: 15 hours ago, 8 flags -
NJ Drones just another Psy-Op
Dissecting Disinformation: 10 hours ago, 4 flags -
My personal experiences and understanding of orbs
Aliens and UFOs: 7 hours ago, 4 flags -
Research paper about plasmoids specifically calls out missing MH370 flight
General Conspiracies: 9 hours ago, 3 flags -
and14263 New Account Not the Same Old Me
Introductions: 17 hours ago, 2 flags
active topics
-
The Mystery Drones and Government Lies --- Master Thread
Political Conspiracies • 131 • : charlyv -
Defending the need for adherence to Old Testament commandments under the new covenant of Christ
Conspiracies in Religions • 52 • : ADVISOR -
My personal experiences and understanding of orbs
Aliens and UFOs • 7 • : Compendium -
Smartest Man in the World Tells His Theory About What Happens At Death
Philosophy and Metaphysics • 24 • : Naftalin -
Russias War Against Religion in Ukraine
World War Three • 35 • : Freeborn -
The truth lets admit it
Aliens and UFOs • 68 • : Naftalin -
-@TH3WH17ERABB17- -Q- ---TIME TO SHOW THE WORLD--- -Part- --44--
Dissecting Disinformation • 3753 • : brewtiger123 -
Trump Cancel trip to New Jersey because of drones
Aliens and UFOs • 77 • : WeMustCare -
Post A Funny (T&C Friendly) Pic Part IV: The LOL awakens!
General Chit Chat • 7923 • : KrustyKrab -
Matt Gaetz ready to go global thermonuclear
US Political Madness • 10 • : WeMustCare
