It looks like you're using an Ad Blocker.
Please white-list or disable AboveTopSecret.com in your ad-blocking tool.
Thank you.
Some features of ATS will be disabled while you continue to use an ad-blocker.
share:
originally posted by: muzzy
I'm getting a lot of full cheese wheels, hopefully I didn't set the base line too low at 100,000KT
I might have to reset it to 476,879 KT, which is equal to 1 x M9.0, its not much use at 8.5, too many full wheels. I started in the 1990's when the energy release was in the 10's of thousands of KT, instead of the 2000's when its in the 100's of thousands.
That's the whole point of course, to be able to see this (or any other) trend, eventually over a 1700 years period.
I'll do a few random years now and see whats the best balance.
edit on 0600000015315315 by muzzy because: (no reason given)
Looks as if Useless have changed something. There has been discussion on the real-time-feed-users email about problems and a response from USGS saying
there had been an outage and "The issue that led to the outage has been resolved, and we do not expect any further interruptions."
What they forgot to say is that the address of some of the older JSON feeds had changed.
You need to change the web address for the USGS M1.0 7 day feed in QVSData to

To view the actual file: earthquake.usgs.gov...
If you are not sure how to do that PM me and I will create a help page on my blog.
Blogged how to do it anyway
qvsdata.wordpress.com...
What they forgot to say is that the address of some of the older JSON feeds had changed.
You need to change the web address for the USGS M1.0 7 day feed in QVSData to

To view the actual file: earthquake.usgs.gov...
If you are not sure how to do that PM me and I will create a help page on my blog.
Blogged how to do it anyway
qvsdata.wordpress.com...
edit on 3/6/2015 by PuterMan because: (no reason given)
M 4.0 - Off the coast of Oregon
Time
2015-06-03 04:25:30 UTC-09:00
Location
44.512°N 129.830°W
Depth
10.0 km
Nearby Cities
458km (285mi) W of Waldport, Oregon
468km (291mi) WNW of Coos Bay, Oregon
517km (321mi) W of Dallas, Oregon
521km (324mi) W of Corvallis, Oregon
540km (336mi) W of Salem, Oregon
earthquake.usgs.gov...
Time
2015-06-03 04:25:30 UTC-09:00
Location
44.512°N 129.830°W
Depth
10.0 km
Nearby Cities
458km (285mi) W of Waldport, Oregon
468km (291mi) WNW of Coos Bay, Oregon
517km (321mi) W of Dallas, Oregon
521km (324mi) W of Corvallis, Oregon
540km (336mi) W of Salem, Oregon
earthquake.usgs.gov...
a reply to: pheonix358
The project is only covering earthquakes over M6.5
The reason is we are talking about Kilo Tons (KT), not Tons like I do for NZ and Japan i.e. 1KiloTon = 1000Tons
So anything below M6.5 is insignificant in relation to the overall energy release if there are some big M8's that year.
For example I just did 2014 using ANSS data. I have now set the base number to 239,006 KT, which is equal to a M8.8. M9.0 is too big a number and the yearly segments are too small. 8.8 should be a reasonable base, producing only 7 full circles in the 1700 year period.
When I downloaded the ANSS data I grabbed the M6.0-6.5 range too (98 of them), to see what % they make up, its only 2,621KT. About the same as a quiet year of M6.5-7.0's.
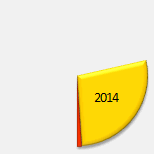
The cheese wheel below shows what proportion the M6.0-6.5 range is in comparison to the other bigger magnitudes combined, and the whole segment in relation to a full wheel which would be 239,006 KT.
If I included M5's as well it wouldn't make much difference.
Apologies to all those killed in quakes below M6.5, there have been thousands died in such events over the years, in places like Iran and China, even NZ (Christchurch 2011) due to old or poorly constructed building collapses. I am not saying quakes less than M6.5 are not significant, but my map part on each page would be saturated with icons if I did include them. Even dropping below M7.0 has casued me a lot of extra work on the files.
What is interesting, is in all the 1700 years worth of data there has never been a M8.9 (well not a 8.9Mw anyway)
As an experiment I have done the first 2 days of June for NZ using the same cheese wheel, but for NZ the scale is TTNT.
Looking over the daily TTNT for May I have set the base for NZ at 477TTNT, which is equal to a M5.0.
As it happensyesterday there was a 5.04 at the Kermadec Islands, so straight away we got a full circle. I tried a few things and came up with this idea. Show the extra TTNT over the 447 base as a segment with the "over 447" showing as a + figure.
I will try that with the M6.5+ project and see what comes out.
Below are the 2 days of June, these show individually on the relevant NZ pages

I just processed M5.0-6.0 data from ANSS for 2014, 1568 events, comes to 2737 KT, so again not going to make that much difference to the cheese wheels. And anything below M5.0 isn't going to be valid, as ANSS don't pick up all M4's.
The project is only covering earthquakes over M6.5
The reason is we are talking about Kilo Tons (KT), not Tons like I do for NZ and Japan i.e. 1KiloTon = 1000Tons
So anything below M6.5 is insignificant in relation to the overall energy release if there are some big M8's that year.
For example I just did 2014 using ANSS data. I have now set the base number to 239,006 KT, which is equal to a M8.8. M9.0 is too big a number and the yearly segments are too small. 8.8 should be a reasonable base, producing only 7 full circles in the 1700 year period.
When I downloaded the ANSS data I grabbed the M6.0-6.5 range too (98 of them), to see what % they make up, its only 2,621KT. About the same as a quiet year of M6.5-7.0's.
The cheese wheel below shows what proportion the M6.0-6.5 range is in comparison to the other bigger magnitudes combined, and the whole segment in relation to a full wheel which would be 239,006 KT.
If I included M5's as well it wouldn't make much difference.

Apologies to all those killed in quakes below M6.5, there have been thousands died in such events over the years, in places like Iran and China, even NZ (Christchurch 2011) due to old or poorly constructed building collapses. I am not saying quakes less than M6.5 are not significant, but my map part on each page would be saturated with icons if I did include them. Even dropping below M7.0 has casued me a lot of extra work on the files.
What is interesting, is in all the 1700 years worth of data there has never been a M8.9 (well not a 8.9Mw anyway)
As an experiment I have done the first 2 days of June for NZ using the same cheese wheel, but for NZ the scale is TTNT.
Looking over the daily TTNT for May I have set the base for NZ at 477TTNT, which is equal to a M5.0.
As it happensyesterday there was a 5.04 at the Kermadec Islands, so straight away we got a full circle. I tried a few things and came up with this idea. Show the extra TTNT over the 447 base as a segment with the "over 447" showing as a + figure.
I will try that with the M6.5+ project and see what comes out.
Below are the 2 days of June, these show individually on the relevant NZ pages

edit on 0600000015315315 by muzzy because: (no reason given)
I just processed M5.0-6.0 data from ANSS for 2014, 1568 events, comes to 2737 KT, so again not going to make that much difference to the cheese wheels. And anything below M5.0 isn't going to be valid, as ANSS don't pick up all M4's.
edit on 0600000015315315 by muzzy because: (no reason
given)
a reply to: muzzy
I have recalibrated the cheese wheels
eg
Now I have that sorted. And now I have connected by wire ( wifi was playing up again, HP fixed it, but its still not right) I need to approach this in a organized way, and proceed backwards.
I have recalibrated the cheese wheels
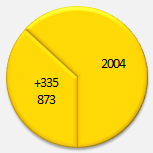
The base line for a full circle is anything over 239,006 Kilo Tons of energy released, approx. equal to a single Magnitude 8.8. Where the energy released in a year exceeds the base line, such as in 2004 where the Sumatra M9.0 earthquake generated 476,879KT on it's own, almost double the base line, the extra KT over the baseline value is shown as a partial segment with a + in front of the number (of KT).
eg

Now I have that sorted. And now I have connected by wire ( wifi was playing up again, HP fixed it, but its still not right) I need to approach this in a organized way, and proceed backwards.
Closer to the Volcanos?
M 2.7 - 13km SW of Morton, Washington
Time2015-06-04 13:48:24 UTC
Location46.490°N 122.418°W
Depth19.3 km
Be Well!
Bishop
M 2.7 - 13km SW of Morton, Washington
Time2015-06-04 13:48:24 UTC
Location46.490°N 122.418°W
Depth19.3 km
Be Well!
Bishop
The West Coast seems to have quieted down which is good news for me.
__
Just woke up from a dream where I was looking at USGS's map and it looked like a 7. something in brazil (near the centre of Brazil). My dreams are never right though, but I thought I'd record it just in case.
__
Just woke up from a dream where I was looking at USGS's map and it looked like a 7. something in brazil (near the centre of Brazil). My dreams are never right though, but I thought I'd record it just in case.
edit on 4-6-2015 by phoenixlights321 because: (no reason given)
a reply to: muzzy
Proceeding backwards is always the way to go
Actually can you proceed backwards or should you just recede? On the subject of going backwards in a proceeding manner I have been playing with energy pie to day, encourage in no small way by Muzzy's plethora of pies. I have been upgrading the QVSData program to create the charts I used to do in the Weekly Geophysical Reports that 1/7,000,000,000th of the world population read each week since that saves so much time and may equally be of interest to 1 person.
I plan to create pies - rhubarb, banoffi, custard, treacle and earthquake data if the latter is of interest. I can show some examples if you would like.
I need to approach this in a organized way, and proceed backwards
Proceeding backwards is always the way to go
Actually can you proceed backwards or should you just recede? On the subject of going backwards in a proceeding manner I have been playing with energy pie to day, encourage in no small way by Muzzy's plethora of pies. I have been upgrading the QVSData program to create the charts I used to do in the Weekly Geophysical Reports that 1/7,000,000,000th of the world population read each week since that saves so much time and may equally be of interest to 1 person.
I plan to create pies - rhubarb, banoffi, custard, treacle and earthquake data if the latter is of interest. I can show some examples if you would like.
Don't see Borneo on the lists much.....
F-E Region: Borneo
Time: 2015-06-04 23:15:44.7 UTC
Magnitude: 5.9
Epicenter: 116.64°E 6.16°N
Depth: 10 km
Status: C - confirmed
geofon.gfz-potsdam.de...
F-E Region: Borneo
Time: 2015-06-04 23:15:44.7 UTC
Magnitude: 5.9
Epicenter: 116.64°E 6.16°N
Depth: 10 km
Status: C - confirmed
geofon.gfz-potsdam.de...
a reply to: PuterMan
Yeah what you got?
Good to see you posting again.
I was getting sick of the bar graphs and line graphs I was doing.
There are probably heaps more options on Excel 2010, I'm actually running Excel 2007, but with a few Spreadsheets I got off the internet and then integrated into Ex2007.
Yeah what you got?
Good to see you posting again.
I was getting sick of the bar graphs and line graphs I was doing.
There are probably heaps more options on Excel 2010, I'm actually running Excel 2007, but with a few Spreadsheets I got off the internet and then integrated into Ex2007.
a reply to: phoenixlights321
I would see that as extremely bad news. Terrible news.
Sphincter quivering news in fact.
You do not want quiet on the quietest segment of the ring of fire.
P
The West Coast seems to have quieted down which is good news for me.
I would see that as extremely bad news. Terrible news.
Sphincter quivering news in fact.
You do not want quiet on the quietest segment of the ring of fire.
P
a reply to: muzzy
Out of respect to those killed in earthquakes less than M6.5 I have changed the name of the Blog to "Strongest Earthquakes". Same address though. I think that better describes what is inside.
Yeah, if half a city is destroyed and dozens of people are killed by a M6.2 then that's significant. But I can't go that low (at this stage) without coloured icons. Hopefully Microsoft will eventually bring their icons into the 21st Century soon, or I figure out a way to do interactive mapping without depending on a 3rd party not being open for business 24/7.
I still can't see what maintenance wikimaps did on the 3 days they were offline, my maps are still there, as well as thousands of one off maps European retailers created just to advertise their location for free.
edit on 0600000015515515 by muzzy because: (no reason given)
a reply to: muzzy
Muzzy, just a thought I had. Please think about it cause it may seem just a little crazy at first.
Bar graphs are REALLY good for showing the differences between years but they are really and epically boring.
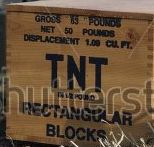
What about if your bar graph was made up of tiny images similar to this but with the size in KT
Just a thought.
P
Muzzy, just a thought I had. Please think about it cause it may seem just a little crazy at first.
Bar graphs are REALLY good for showing the differences between years but they are really and epically boring.
What about if your bar graph was made up of tiny images similar to this but with the size in KT

Just a thought.
P
M5.0 - 93km NE of Amsterdam Island, France
Time
2015-06-05 14:54:00 (UTC)
2015-06-05 07:54:00 (UTC-07:00) in your timezone
Times in other timezones
Nearby Cities
93km (58mi) NE of Amsterdam Island, France
2405km (1494mi) SSE of Ile Rodrigues, Mauritius
2713km (1686mi) SE of Mahebourg, Mauritius
2714km (1686mi) SE of Plaine Magnien, Mauritius
2747km (1707mi) SE of Port Louis, Mauritius
earthquake.usgs.gov...
____________
I had another dream. I was looking at the USGS map in my dream and there was a 9.1 in nicaragua.
a reply to: pheonix358
I know what you mean. Good idea.
Hey what about sticks of dynamite stacked up the bars?
each stick could represent 1 Ton (or KT) or whatever
I'll look into it.
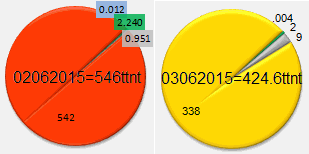
I tried doing split pie charts for NZ energy, but if there is a big M4 or a M5 it doesn't really work.
here is what a couple looked like. Its the same problem as the earlier ones I did for the M6.5+ project, fitting the numbers in.

edit on 0600000015515515 by muzzy because: (no reason given)
edit on 0600000015515515 by muzzy because: (no reason
given)
All this talk of cheese wheels, slices, pies (pumpkin pie is my favourite) and now this.
I'm still capturing the Hakone swarm in Japan daily.
The activity has moved south again away from the Botanical Gardens where it has been centred for about a week, now its between the On Hots Springs (Hotel?) and
"Owakudani black eggs Museum"
maybe its the translation?
black eggs, whats that about I wonder?
and why would they have a Museum of them?
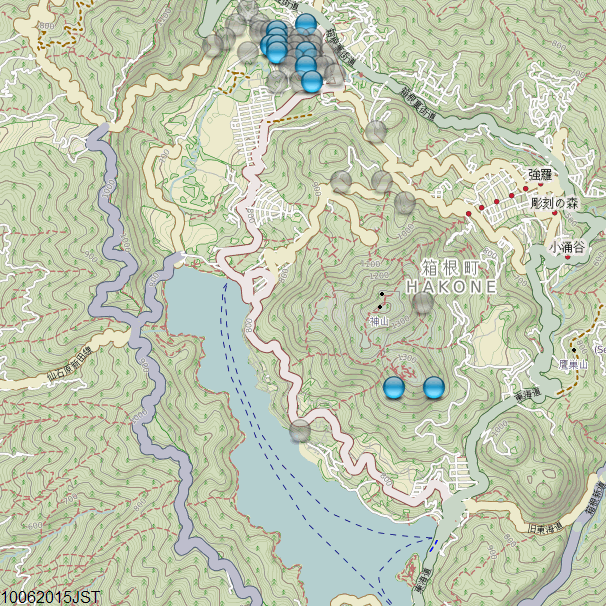
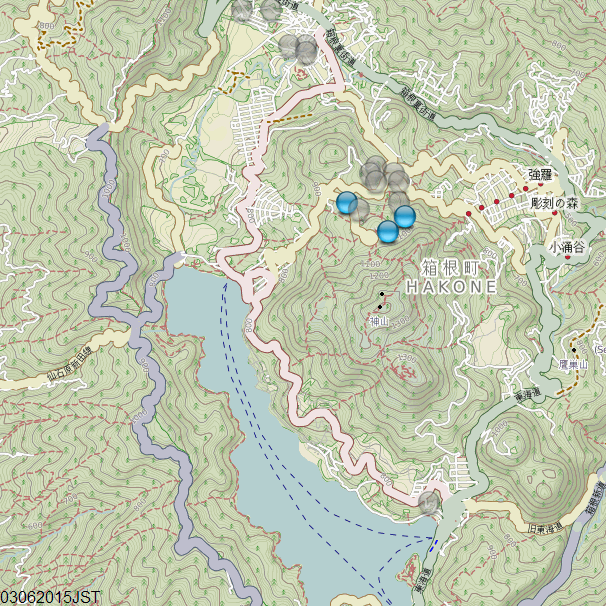
I get the location names on Google maps, they now have little icons of locations of interest, on the GM it is in Japanese, but its easy enough to copy and paste the text and translate on Google Translate.
I still use Google for stuff, its just the dumping of Google Maps Classic that got me so pissed off.
I'm still capturing the Hakone swarm in Japan daily.
The activity has moved south again away from the Botanical Gardens where it has been centred for about a week, now its between the On Hots Springs (Hotel?) and
"Owakudani black eggs Museum"
maybe its the translation?
black eggs, whats that about I wonder?
and why would they have a Museum of them?


edit on 0600000015515515 by muzzy because: (no reason given)
I get the location names on Google maps, they now have little icons of locations of interest, on the GM it is in Japanese, but its easy enough to copy and paste the text and translate on Google Translate.
I still use Google for stuff, its just the dumping of Google Maps Classic that got me so pissed off.
edit on 0600000015515515 by muzzy because:
(no reason given)
new topics
-
New York Governor signs Climate Law that Fines Fossil Fuel Companies
US Political Madness: 4 hours ago -
Meta Llama local AI system is scary good
Science & Technology: 10 hours ago -
This is why ALL illegals who live in the US must go
Social Issues and Civil Unrest: 11 hours ago
top topics
-
This is why ALL illegals who live in the US must go
Social Issues and Civil Unrest: 11 hours ago, 18 flags -
New York Governor signs Climate Law that Fines Fossil Fuel Companies
US Political Madness: 4 hours ago, 12 flags -
Former ‘GMA Producer’ Sues NPR-Legacy Media Exposed
Propaganda Mill: 15 hours ago, 9 flags -
Happy Hanukkah…
General Chit Chat: 16 hours ago, 8 flags -
UK Borders are NOT Secure!
Social Issues and Civil Unrest: 13 hours ago, 6 flags -
Meta Llama local AI system is scary good
Science & Technology: 10 hours ago, 6 flags -
New Footage - Randy Rhoads 1979 LIVE Guitar Solo Footage at the Whisky - Pro Shot
Music: 15 hours ago, 5 flags
active topics
-
Happy Hanukkah…
General Chit Chat • 23 • : JJproductions -
This is why ALL illegals who live in the US must go
Social Issues and Civil Unrest • 23 • : WeMustCare -
Statements of Intent from Incoming Trump Administration Members - 2025 to 2029.
2024 Elections • 57 • : WeMustCare -
Meta Llama local AI system is scary good
Science & Technology • 24 • : glend -
The Mystery Drones and Government Lies --- Master Thread
Political Conspiracies • 153 • : WeMustCare -
Putin Compares Himself to Jesus Promoting Traditional Values Against the Satanic West
Mainstream News • 77 • : Dalamax -
Former ‘GMA Producer’ Sues NPR-Legacy Media Exposed
Propaganda Mill • 5 • : WeMustCare -
New York Governor signs Climate Law that Fines Fossil Fuel Companies
US Political Madness • 10 • : CosmicFocus -
FAA Investigates Christmas Drone Show Gone Wrong in Orlando, FL 12/2024
Other Current Events • 13 • : Astrocometus -
DefCon Teetering on Escalation
World War Three • 53 • : annonentity
