It looks like you're using an Ad Blocker.
Please white-list or disable AboveTopSecret.com in your ad-blocking tool.
Thank you.
Some features of ATS will be disabled while you continue to use an ad-blocker.
share:
There was minor earthquake here in Finland. It was only 2.5 magnitude, but they are very rare and felt on wide area. There is no depth data. Even
though it was only 2.5, people felt it. It was first reported as 2.3 magnitude quake, but its now fixed to 2.5. That was strongest earthquake this
year. These earthquakes are caused by both post-glacial rebound and expansion of Atlantic Ocean. No aftershocks have been recorded.
2014 11 22 16:18:37.1 65.046 27.399 2.5LHEL

yle.fi...
Finland earthquake map, University of Helsinki
2014 11 22 16:18:37.1 65.046 27.399 2.5LHEL

yle.fi...
Finland earthquake map, University of Helsinki
edit on 22-11-2014
by Thebel because: (no reason given)
a reply to: Thebel
No, you don't get many do you
I tracked the whole of Scandinavia for a while in 2013 using NORSAR and Finland only had a couple in the whole period.
No, you don't get many do you
I tracked the whole of Scandinavia for a while in 2013 using NORSAR and Finland only had a couple in the whole period.
originally posted by: muzzy
a reply to: Thebel
No, you don't get many do you
I tracked the whole of Scandinavia for a while in 2013 using NORSAR and Finland only had a couple in the whole period.
Well, some are not real quakes, some are just explosions. But seems like there was another 2.3 detected few hours ago, but it was far from the first one, near Jyvaskyla. This is rare case to have two so "strong" earthquakes in one day. There is clearly some stress in Mid-Atlantic Ridge which beams this far.
2014 11 22 16:18:37.1 65.046 27.399 2.5LHEL
2014 11 22 19:17:53.0 62.148 25.956 2.3LHEL
yeah thanks pheonix, it sux alright.
I'm not going to let the b%$@&^d's win though
goodbye Mr. Aftershock
welcome Mr. 499 (that's the number of events that is just under the threshold of 500 items)
So the people of Nagano, Japan want to know what the heck happened and how many and how big are these aftershocks they are feeling from the 6.1ML at 22/11/2014 22:08:18JST
Where do they go to find out? Well Mr. 499 can help!
There have been 425 aftershocks in the 12hrs 35minutes since the Main shock
mag less than 1= 123
mag1= 221
mag2= 68
mag3= 12
mag4= 1
mag5= 0
mag6= 1
total= 426
TTNT= 21,349.200TTNT energy released
No thanks to Google we bring you an aftershock map, of sorts
still has issues, the green Mag 2 icons are not showing, who knows why
map*
* hopefully the map works here, first time I've tried a link from MyMaps
edit on 11u32532514 by muzzy because: technical difficulties
edit on 11u32532514 by muzzy because: (no reason given)
a reply to: muzzy
Yes it worked. Nice map.
Muzzy, people are people. If an EQ happens and no one dies, people just go, gee another 6.3, yeah, Ok.
If an EQ hits and 100,000 are dead and cities are in ruin, people want all the info possible.
It is human nature. Those eight views from scholars are worth more than the 1000 views after people get killed IMHO.
P
a reply to: pheonix358
thanks, it did load, thats one step in the right direction.
The problem with the icons can be seen in the two images below.
basically MyMaps sux, it can't cope with multiple items like Classic Maps does/did.
Classic Maps (which I use on my blog and here on ATS) shows the true magnitude of each event by the colour, MyMaps screwed it up, they are all intermingled, 2's are blue, and less than 1's are blue too, 1's are blue which they are supposed to be. A fault in the MyMaps program. It should never have been released until the bugs were sorted out, or at least kept Classic Maps as a backup until they sorted out the bugs.
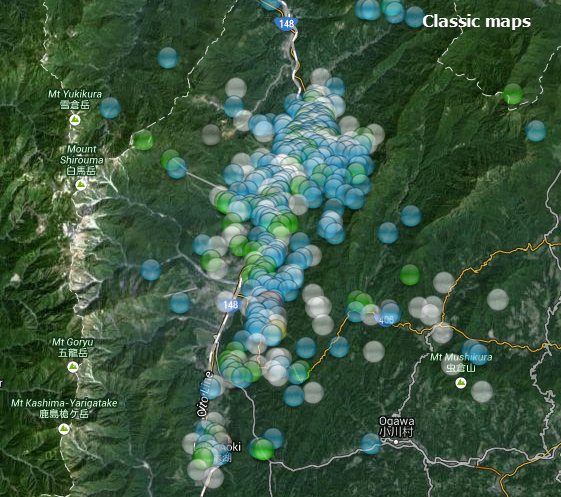
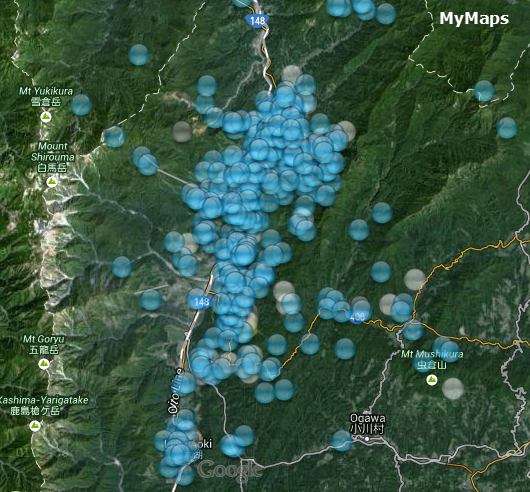
whine over, I'll keep trying to wriggle the icons into the maps correctly
thanks, it did load, thats one step in the right direction.
The problem with the icons can be seen in the two images below.
basically MyMaps sux, it can't cope with multiple items like Classic Maps does/did.
Classic Maps (which I use on my blog and here on ATS) shows the true magnitude of each event by the colour, MyMaps screwed it up, they are all intermingled, 2's are blue, and less than 1's are blue too, 1's are blue which they are supposed to be. A fault in the MyMaps program. It should never have been released until the bugs were sorted out, or at least kept Classic Maps as a backup until they sorted out the bugs.


whine over, I'll keep trying to wriggle the icons into the maps correctly
Woke up & thought I might as well check things before I go back to sleep.
M 5.4 - Off the coast of Oregon
Time 2014-11-23 11:01:25 UTC
Location 43.798°N 128.408°W
Depth 10.0km
WOQ
SOURCE: USGS
M 5.4 - Off the coast of Oregon
Time 2014-11-23 11:01:25 UTC
Location 43.798°N 128.408°W
Depth 10.0km
WOQ
SOURCE: USGS
edit on 23-11-2014 by wasobservingquietly because: (no reason given)
and an aftershock?
M4.9 - Off the coast of Oregon
2014-11-23 12:50:49 UTC
Location: 43.859°N 128.131°W
Depth: 10.0km (6.2mi)
Nagano, Japan 6.1Ml aftreshocks @ 43 hours elapsed
well its actually Hakuba-Otari
mag lessthan1= 484
mag1= 439
mag2= 101
mag3= 19
mag4= 2
mag5= 0
mag6= 1
mag7= 0
total= 1046
TTNT= 21,385.25
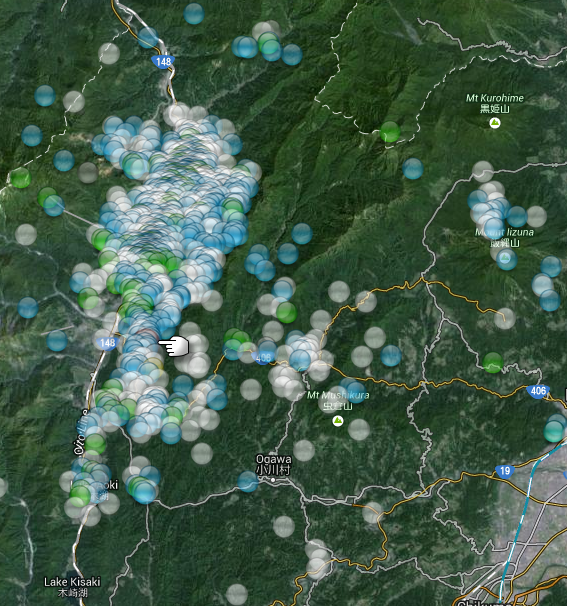
usually I'd do you an interactive map, but as you see the total is 1046, way over my allowance of 499, even though that stuffed up anyway.
here is the best you get now, an image, thank GPS Visualiser, not Google Maps.
finger points to the M6.1
note progression north to Otari

edit on 11u32732714 by muzzy because: (no reason given)
Here's an animation of the Hakuba-Otari aftershocks up to 43 hours elapsed time, built on GPS Visualiser, on a topo map from Open Street Maps,
I won't load it to ATS directly, as it's 10.3MB size
This is a step away from having to use Google Mess (Maps).
This is at full speed, based on hourly data, after the initial 1st run through at slow speed (I think, may depend on your browser)
Gives an indication of where the fault is at and which direction the failure went
dl-web.dropbox.com...
Timeline graph too, looks like its pretty standard stuff
rightclick"viewimage"forfullsize
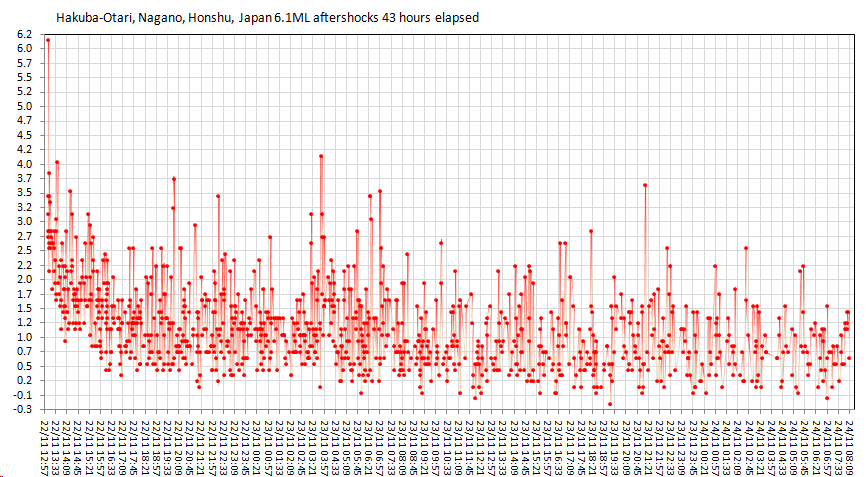
I won't load it to ATS directly, as it's 10.3MB size
This is a step away from having to use Google Mess (Maps).
This is at full speed, based on hourly data, after the initial 1st run through at slow speed (I think, may depend on your browser)
Gives an indication of where the fault is at and which direction the failure went
dl-web.dropbox.com...
edit on
1100000032732714 by muzzy because: trouble with the link, just started using Dropbox again, and thy have changed the way it works wth
links
Timeline graph too, looks like its pretty standard stuff
rightclick"viewimage"forfullsize

edit on 1100000032732714 by muzzy because: (no reason given)
a reply to: muzzy
Damn the animation doesn't show does it.
Will look into it.
edit; Wow Dropbox are limiting stuff now too as well as Google. You can no longer access your stuff on the new Dropbox to share with the Public (i.e you guys)
What the heck is going on? So much for the "Cloud" being the answer to the future. You can store but you can't share. What use is that?
It even applies to Dropbox Pro, which costs about $US120 a year, you do get a Public Folder but it has limits on how many downloads there can be.
Some people have had their accounts suspended for excessive traffic blog.the-ebook-reader.com...
whats this all about I wonder? the Cloud already nearly full?
So both Dropbox and Google Drive playing the same game!
They are both free , but only for long enough to get you hooked in and dependent on the services enough to pay for a Pro account.
Then they restrict the Pro account too.
Total BS.
Censorship!
edit on 1100000032732714 by muzzy because: (no reason given)
I'm determined to get this on here, took a lot of work this wet and rainy morning
Only way around it is use Wordpress
How long till they limit stuff too? 3GB limit already on Japan
eqarchivesj.files.wordpress.com...
or you can see it here on a eqjapan post
Only way around it is use Wordpress
How long till they limit stuff too? 3GB limit already on Japan
eqarchivesj.files.wordpress.com...
or you can see it here on a eqjapan post
edit on 1100000032732714 by muzzy because: (no reason given)
May have found an alternative to having to use Google Maps to get interactivity.
ikimaps.
comes from Spain.
I did a test, seems to work OK, had me a bit puzzled why the earthquake icons were split into two groups, then realized it was the Antimeridian, where the Longitude changes from + to -
takes a bit of getting used to
can be done without using Google Messup (although this one does the Google Streets view because thats the way I saved it, too late to change)
Will have a play around with it, can't get the i-frame html to work in Wordpress, so at the moment you have to click the image to get it started.
test 6 (is for NZ Nov 23rd 2014)
early days yet, says it has a limit of 700 items, but also says it has a limit of 70,000 Lat/Long combinations, that's a bit ambiguous, needs experimenting with to see what it can do.
Maps without the nasty corporates, great stuff!
I can even do it directly here on ATS, without the need for Wordpress
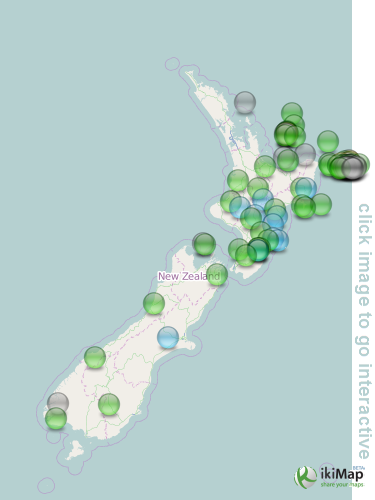
yeah is limited to 700 elements (icons or trace segements) just did a test using LDEO data, with the Plate Boundries in it, too many elements with the fault segement 1588
So it has its limits.
But I still like it!
so ............. bye bye google mymaps

ikimaps.
comes from Spain.
I did a test, seems to work OK, had me a bit puzzled why the earthquake icons were split into two groups, then realized it was the Antimeridian, where the Longitude changes from + to -
takes a bit of getting used to
can be done without using Google Messup (although this one does the Google Streets view because thats the way I saved it, too late to change)
Will have a play around with it, can't get the i-frame html to work in Wordpress, so at the moment you have to click the image to get it started.
test 6 (is for NZ Nov 23rd 2014)
early days yet, says it has a limit of 700 items, but also says it has a limit of 70,000 Lat/Long combinations, that's a bit ambiguous, needs experimenting with to see what it can do.
Maps without the nasty corporates, great stuff!
edit on 11u32932914 by muzzy because: (no reason given)
I can even do it directly here on ATS, without the need for Wordpress

edit on 1100000032932914 by muzzy because: more exciting
developments
yeah is limited to 700 elements (icons or trace segements) just did a test using LDEO data, with the Plate Boundries in it, too many elements with the fault segement 1588
So it has its limits.
But I still like it!
so ............. bye bye google mymaps

edit on 1100000032932914 by muzzy because: (no reason given)
Magnitude 7.0 6.8 - Northern Molucca Sea (266)
Location in Google Maps
- Date-Time: Wednesday, November 26, 2014 @ 14:33:47 UTC
- Earthquake location: 1.900°N, 126.600°E,
- Earthquake depth: 65.0 km
- Distances:
150km (93mi) NW of Kota Ternate, Indonesia
150km (93mi) NW of Ternate, Indonesia
157km (97mi) W of Tobelo, Indonesia
165km (102mi) ENE of Bitung, Indonesia
1061km (659mi) SW of Koror Town, Palau
- Event ID: at00nfnhsd
Derived from Event Data Source: USGS
Powered by QVSData
This may be 6.9 which is how it is being reported by others - yes dropped to 6.8. EMSC are going 6.9 and GFZ 6.7
edit on 26/11/2014 by PuterMan
because: (no reason given)
a reply to: muzzy
The cloud never will be the answer. Way too much information getting into the wrong hands (read that as you wish as this is a conspiracy site). In the same way the world wide web is not the answer either.
The technology is coming where you can host your earthquake files on the Internet on your own PC and yet have them available world wide with no traceability - it is all based on the bitcoin algorithms. No a*** corporations to screw things up for you and keep on changing the rules. As soon as a company has shareholders you can guarantee YOU will not get the best deal.
So much for the "Cloud" being the answer to the future.
The cloud never will be the answer. Way too much information getting into the wrong hands (read that as you wish as this is a conspiracy site). In the same way the world wide web is not the answer either.
The technology is coming where you can host your earthquake files on the Internet on your own PC and yet have them available world wide with no traceability - it is all based on the bitcoin algorithms. No a*** corporations to screw things up for you and keep on changing the rules. As soon as a company has shareholders you can guarantee YOU will not get the best deal.
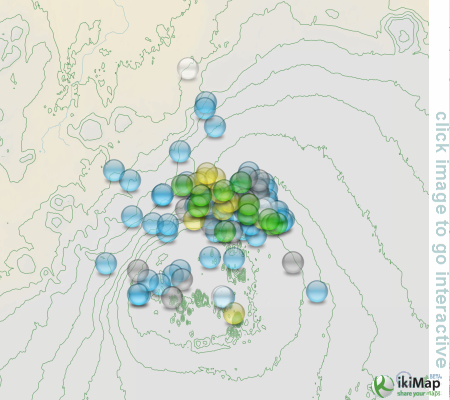
I had a few goes at using the ikimap system for the Bardarbunga-Holuhraun page, figured how to get it settled in one spot and zoom level, in this case
on the Caldera area where most of the earthquake activity is at, just need to set up the screenshot perameters on Snagit to make them consistent on a
daily basis.
By default the links were going to Google Street view, which is what I want to get away from.
I works for me, but not sure if that is only because I'm logged in to ikimaps.
See if this works here.
link to blog page
edit: I logged out of ikimaps, and it works OK
sweeeeeeeeeeeeeeeeet
question is, how many maps will they allow me?, I seen last night on the Explore page ( link top center above my map) that one person had 326 maps, so it might be OK to do them daily, if there are restrictions it might mean having to do them once a week, which becomes awkward if there are restrictions on the number of elements/events/icons (700) as both Iceland and New Zealand have over 700 earthquakes a week.
By default the links were going to Google Street view, which is what I want to get away from.
I works for me, but not sure if that is only because I'm logged in to ikimaps.
See if this works here.

link to blog page
edit: I logged out of ikimaps, and it works OK
sweeeeeeeeeeeeeeeeet
question is, how many maps will they allow me?, I seen last night on the Explore page ( link top center above my map) that one person had 326 maps, so it might be OK to do them daily, if there are restrictions it might mean having to do them once a week, which becomes awkward if there are restrictions on the number of elements/events/icons (700) as both Iceland and New Zealand have over 700 earthquakes a week.
edit on
1100000032932914 by muzzy because: (no reason given)
new topics
-
DOJ Special Counsel Robert HUR Says JOE BIDEN Can Be ARRESTED After Jan 20th 2025.
Above Politics: 1 hours ago -
More Proof of Lawfare
US Political Madness: 7 hours ago -
I thought Trump was the existential threat?
World War Three: 9 hours ago -
Interesting Video-UFO?
Aliens and UFOs: 10 hours ago -
Joe Biden Dabs Away Tears at Farewell White House Dinner
Politicians & People: 10 hours ago
top topics
-
I thought Trump was the existential threat?
World War Three: 9 hours ago, 18 flags -
More Proof of Lawfare
US Political Madness: 7 hours ago, 18 flags -
Joe Biden Dabs Away Tears at Farewell White House Dinner
Politicians & People: 10 hours ago, 9 flags -
Interesting Video-UFO?
Aliens and UFOs: 10 hours ago, 6 flags -
DOJ Special Counsel Robert HUR Says JOE BIDEN Can Be ARRESTED After Jan 20th 2025.
Above Politics: 1 hours ago, 4 flags
active topics
-
I thought Trump was the existential threat?
World War Three • 49 • : tamusan -
More Proof of Lawfare
US Political Madness • 26 • : ElitePlebeian2 -
DOJ Special Counsel Robert HUR Says JOE BIDEN Can Be ARRESTED After Jan 20th 2025.
Above Politics • 6 • : WeMustCare -
Joe Biden Dabs Away Tears at Farewell White House Dinner
Politicians & People • 23 • : xuenchen -
On Nov. 5th 2024 - AMERICANS Prevented the Complete Destruction of America from Within.
2024 Elections • 159 • : WeMustCare -
What if this is true?
2024 Elections • 30 • : chr0naut -
Petition Calling for General Election at 564,016 and rising Fast
Political Issues • 88 • : Freeborn -
Well, here we go red lines crossed Biden gives the go ahead to use long range missiles
World War Three • 360 • : Freeborn -
Encouraging News Media to be MAGA-PAF Should Be a Top Priority for Trump Admin 2025-2029.
Education and Media • 79 • : DBCowboy -
BIDEN and Zelenskyy are Putting Together a TEN YEAR Package of Weapons -n- Cash for Ukraine.
World War Three • 24 • : WeMustCare
