It looks like you're using an Ad Blocker.
Please white-list or disable AboveTopSecret.com in your ad-blocking tool.
Thank you.
Some features of ATS will be disabled while you continue to use an ad-blocker.

New Activity at Mt. Rainier Confirmed to Be Seismic (...or ICE?), Right here on ATS!
page: 12share:
reply to post by westcoast
LOL--this mountain can't twitch without us saying, "Explain yourself!"
Westcoast, I hear you about the strange nature of the signals--such as Observation Rock. I checked around USGS, but I couldn't find anything large enough, deep enough, or the right time frame to account for the teleseism-like trace.
And the amplitude has gone up significantly. I'm hoping it is just the weather.
edit on 1/18/2012 by Olivine because: add info
Sorry I dont have much time today and didnt read all the pages. In case no one has brought it up yet, Rainier has done this before every big
earthquake starting with the December 26th quake. It will be interesting to see if it happens again. There are several pages over the past several
years accumulated here on ATS that show as much. There are also a couple other in the cascades that do the same thing just not as notably.
Scientists have said that they are on a different system than the others like St. Helens. Also I am wondering if anyone has checked solar activity.
The three run hand in hand (rainier, solar activity, huge earthquake)
Edit to add, if it is the case, you will notice them becoming stronger and stronger more frequently until the whole page is solid. That is when the earthquake happens. However there was one cant remember off the top of my head which that hapened when it was only half way to the solid mark. That quake was not as strong. If it runs solid for a few days there is bound to be a 8+ quake to follow. Every time.
Edit to add, if it is the case, you will notice them becoming stronger and stronger more frequently until the whole page is solid. That is when the earthquake happens. However there was one cant remember off the top of my head which that hapened when it was only half way to the solid mark. That quake was not as strong. If it runs solid for a few days there is bound to be a 8+ quake to follow. Every time.
edit on 18-1-2012 by
mrsdudara because: (no reason given)
reply to post by westcoast
I likely won't be able to go back and read every page but have been monitoring a lot sporadically.
What are the inputs or conjectures or guesses
about the contention that LA is going to have a
9.X purportedly within a few weeks to a few months?
I'm picking up on prophetic inputs on various Christian prophetic sites.
reply to post by mrsdudara
I know you said you haven't read the whole thread, so perhaps you don't understand the basis of it. This has turned out to be a documented 'event' by the PNSN that has so far been theorized as a glacier stick-slip. There are three other documented cases in 1990, 1998 and 2010. This has been going on for about three weeks now. The last few posts are about a marked change in the activity. If you get some more time later to better explain what you are referring to, that would be great. Certainly, when you speak of a 8+ quake, you mean somewhere else in the world, because there has never been a 'documented' one here that could be seen on a seismometer...the nearest would be the last mega quake about 300 yrs ago, but the only way they nailed down the time-frame was because of the tsunami in Japan from it.
I have NEVER seen a seismo for Rainier 'solid' (unless from an equipment failure). It would be great if you could find an example.
Anyways, I got a response from PNSN (they are really great about answering questions). Her best, educated guess is that it was possibly an ice avalanche, caused by all the recent snow. I guess there was a documented case of the ice 'chattering' as it went down up at Baker in the past...but this of course is in the reverse. if you look at the seismos, It appears like there was some sort of slide or 'burst' and then the 'chattering'.
PNSN even provided me with a paper on this phenomenon (centered around a study at an alaskan volcano).
This might sound stupid, but I really want to make sure that I souce this article right. I got this document in a PDF format...so I saved the best image of the seismo example as a picture so I could share it with you, but I have to source it and give credit. I did a search on line for the document, and found the abstract with the link provided, to get the full document. I hope that is enough. So, here is the image, showing the 'chatter' previous and building up to an avalanche (click to enlarge and you will need to zoom in to see it)
" target='_blank' class='tabOff'/>
source - abstract
Here is the basic summary:
So....while the seismos look somewhat similar, the obvious problem with this is that what we just saw is backwards.
Does that mean it can't be the culprit? Well, no, because no one really knows for sure what is going on or what is even possible. I supose all we can do is keep watching and see what, if anything else develops. Most definitely interesting though.
I think the best thing we could do right now is listen to it. SO...if anyone wants to or can take that task on....go for it!!!!!
I know you said you haven't read the whole thread, so perhaps you don't understand the basis of it. This has turned out to be a documented 'event' by the PNSN that has so far been theorized as a glacier stick-slip. There are three other documented cases in 1990, 1998 and 2010. This has been going on for about three weeks now. The last few posts are about a marked change in the activity. If you get some more time later to better explain what you are referring to, that would be great. Certainly, when you speak of a 8+ quake, you mean somewhere else in the world, because there has never been a 'documented' one here that could be seen on a seismometer...the nearest would be the last mega quake about 300 yrs ago, but the only way they nailed down the time-frame was because of the tsunami in Japan from it.
I have NEVER seen a seismo for Rainier 'solid' (unless from an equipment failure). It would be great if you could find an example.
Anyways, I got a response from PNSN (they are really great about answering questions). Her best, educated guess is that it was possibly an ice avalanche, caused by all the recent snow. I guess there was a documented case of the ice 'chattering' as it went down up at Baker in the past...but this of course is in the reverse. if you look at the seismos, It appears like there was some sort of slide or 'burst' and then the 'chattering'.
PNSN even provided me with a paper on this phenomenon (centered around a study at an alaskan volcano).
This might sound stupid, but I really want to make sure that I souce this article right. I got this document in a PDF format...so I saved the best image of the seismo example as a picture so I could share it with you, but I have to source it and give credit. I did a search on line for the document, and found the abstract with the link provided, to get the full document. I hope that is enough. So, here is the image, showing the 'chatter' previous and building up to an avalanche (click to enlarge and you will need to zoom in to see it)
" target='_blank' class='tabOff'/>
source - abstract
Here is the basic summary:
Each of the avalanches was preceded by up to 2 hours of seismicity believed to represent the initial stages of failure. Each seismic sequence begins with a series of repeating earthquakes thought to represent slip on an ice-rock interface, or between layers of ice. This stage is followed by a prolonged period of continuous ground-shaking that reflects constant slip accommodated by deformation at the glacier base. Finally the glacier fails in a large avalanche.
So....while the seismos look somewhat similar, the obvious problem with this is that what we just saw is backwards.
Does that mean it can't be the culprit? Well, no, because no one really knows for sure what is going on or what is even possible. I supose all we can do is keep watching and see what, if anything else develops. Most definitely interesting though.
I think the best thing we could do right now is listen to it. SO...if anyone wants to or can take that task on....go for it!!!!!
edit on
18-1-2012 by westcoast because: (no reason given)
edit on 18-1-2012 by westcoast because: (no reason given)
Fast Chatter on Rainier an hour ago
PNSN is definitely quick to respond, both to private correspondance and online. Thanks for the info, westcoast. And PNSN thanks you too!
ETA: The signatures in the document they gave you are completely backward. Slow start to an abrupt and noisy stop. Our recent event was just the opposite. I'm going to have to think on this for a while...
PNSN is definitely quick to respond, both to private correspondance and online. Thanks for the info, westcoast. And PNSN thanks you too!
edit on 1/18/2012 by Olivine because: spelling
ETA: The signatures in the document they gave you are completely backward. Slow start to an abrupt and noisy stop. Our recent event was just the opposite. I'm going to have to think on this for a while...
edit on 1/18/2012 by Olivine because: thinking out loud
Things are heating up: Mag 2.1
USGS
Only a few miles from the base of the mountain.
USGS
Magnitude:2.1 Md
Time:
Thu January 19, 2012 08:53AM (PST)
Thu January 19, 2012 16:53 (GMT)
Distance From:
27.0 km ( 16.8 mi) S ( 170. azimuth) from Enumclaw, WA
27.9 km ( 17.3 mi) ENE ( 67. azimuth) from Eatonville, WA
48.7 km ( 30.3 mi) SE ( 128. azimuth) from Tacoma, WA
Coordinates:
46.9658318, -121.9276657
Depth:
9.01 Km (5.5 miles)
Location Quality:
Excellent
Event Id:
60370857
Horizontal Uncertainty:
0.25 Km
Depth Uncertainty:
0.38 Km
Azimuthal Gap:
79.0 deg
Number of Phases:
30
RMS Misfit:
0.15
Only a few miles from the base of the mountain.
OK, well got some news! Too much news. Got a very comprehensive response to my email, from more than one person there. Very interesting. But I need
more time to digest this, and from a technical standpoint, I am probably going to try to get PuterMan involved with what I know now about the
instruments, and some other information from them.
The best people they have are still not 100% sure these are ice quakes. But from the sounds of it, and previous experience with them, they are almost sure. And you know, maybe at some point we really just need to take their word for it. We can sit here and conjecture all we want to, but they have got by far the best equipment, knowledge and experience, that anyone here is going to have a very hard time equaling.
However.
One of the key questions was to gauge to what extent the glacier attenuates these signals, because that to me is very important. The answer: They are attenuated "strongly". (Again, first skim over, so I am trying to be more accurate. I removed the word "very" upon further reading of their info.) For now, I will leave it at that. Gonna have to digest this a bit, but for now just know I am still working on it and will report back once I feel there is something worth reporting.
edit on Thu Jan 19th 2012 by TrueAmerican because: (no reason given)
reply to post by TrueAmerican
I know what you mean TA.
I feel that they have been extremely forthcoming with info and opinions. They believe it to be ice quakes, but aren't positive. They may never know for sure, unless of course something else happens.
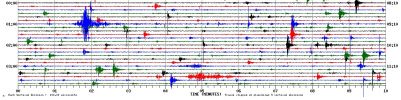
I just noticed that there seems to be at least three other multiplets developing. It'll be interesting to keep an eye on them and see if they grow in size too. I have drawn circles around the bigger ones that we have been watching for weeks now...and drawn lines through the new patterns that are emerging. They are all three distinctly different:
Thumbnail....click to enlarge:
" target='_blank' class='tabOff'/>
source
I know what you mean TA.
I feel that they have been extremely forthcoming with info and opinions. They believe it to be ice quakes, but aren't positive. They may never know for sure, unless of course something else happens.
I just noticed that there seems to be at least three other multiplets developing. It'll be interesting to keep an eye on them and see if they grow in size too. I have drawn circles around the bigger ones that we have been watching for weeks now...and drawn lines through the new patterns that are emerging. They are all three distinctly different:
Thumbnail....click to enlarge:
" target='_blank' class='tabOff'/>
source
edit on 19-1-2012 by westcoast because: (no reason
given)
end of the page for 1-20-12 for
RCS
RCM
LO2
STAR
RCS

RCM

LO2

STAR

edit on 20-1-2012 by berkeleygal because: (no reason given)
Apparently there was another "rumble and skid" event this morning at 09:01:00 UTC on Mt. Rainier. (the large blue trace)
 (click to enlarge)
Camp Schurman old webi
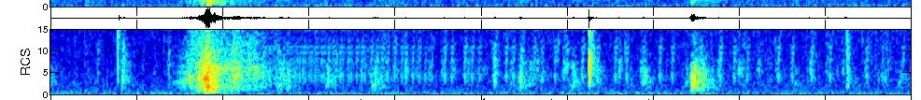
This is the spectrogram from the event. They also found one from STAR station in December 2010.
 (click to enlarge)
This info was added later today on the seismo blog found Here.
Nothing else to report...
 (click to enlarge)
 Camp Schurman old webi
This is the spectrogram from the event. They also found one from STAR station in December 2010.
 (click to enlarge)
 This info was added later today on the seismo blog found Here.
Nothing else to report...
edit on 1/21/2012 by Olivine because: spelling
edit on 1/21/2012 by Olivine because: wrong
image
reply to post by Olivine
Good find!!
You know....these rare events just keep stacking up, don't they? Now, not to say that any of them by themselves would be alarming, but seems like each time something else comes along, it takes digging into archives or looking at past papers to come up with possible answers. It could all still just be very benign, individual occurances caused by nothing more than slippery glaciers and a bunch of snow, BUT...I have ALWAYS said that I do NOT like coincidences and you know what? I do NOT like these coincidences.
BTW, there are now other, VERT clear multiplets occuring, including those sharp 8mic/sec at RCS. Those are the ones that typically you would look at and write it off to an ice quake, but there is again a clear, distinct pattern. In fact, there are so many of them now that it is becoming quite difficult to follow it. I can feel myself getting complacent....already used to all of the activity. If I were to open those webis up today without having seen of this action the past few days, I think I would freak out. Hmmmmm..........
Well, I have another bit of news, but this is more on a personal side, and yet it still applies. I have managed to acquire a professional level tool
set. I am sorry GEE users, but I am going to have to learn a new, much more comprehensive (and complicated) system now, so GEE is going to take a
second seat for me.
But the silver lining is that now I am able to do a whole lot more, and much quicker. And I can confirm that these ice quakes fail to exhibit the higher frequencies normally present in tectonic/volcanic quakes. So is the ice attenuating these events, or is it the ice itself creating them? The big question, and you already have the pro's opinions on that. They believe they are the ice.
But at a glance now I can see instantly that all that stuff that looks like tremor at RCS and RCM/STAR is merely wind noise. I don't even have to check the wind speeds anymore. The frequency content is displayed easily. It never hurts to have independent confirmation of what the scientists are telling us, for those that question their motives or data.
I am very excited about this, but I have a lot of work to do now to learn and configure this rig. I must relearn how to gauge amplitudes in Counts now, as opposed to microns/sec or nm/sec. And I have no previous point of reference, since I learned on GEE. So this is gonna take a while. I may have to run GEE for a while to compare the same event in the different programs and try to make some sense of it all. But I am totally stoked about this actually. Because now, I have literally become the actual webicorder, and have control over how to display the webicorder plots, and so much more. It is fricken amazing, and WAY beyond what I am used to in GEE. But hopefully in the next months I will be able to get a much better grip on this.
And of course, the ultimate goal, to become more accurate and better able to describe the events that happen around us, for all to benefit from.
Yes, darn straight I am happy about this acquisition. It may spur me on to go back to school for a degree, but that's expensive, and I do not have the money.
Originally posted by Olivine
reply to post by TrueAmerican
Congrats, TA.
I'm jealous
No no, please don't be. Give me some time at this and I may share. I am not trying to be Mr. Holdout with this, but there could be some issues with me trying to share. Not sure I can at the moment. Must find out. This was a favor to me. I don't want to ruin it.
reply to post by TrueAmerican
Not what I meant at all. For goodness sakes, we all know I can barely handle GEE, lol!
You take all the time you need to get up to speed. If you need a test problem, I have an event I can't find an epicenter for.....
I just meant that I was jealous because I like new toys. Have fun,
ETA: Hey TrueAmerican, any chance you can look at STAR, RCS, and RCM at 19:25:35 UTC? Is that under the mountain, or farther away. I'm currently looking farther out.. Thanks
Looking at amplitudes, it looks like it was probably on the north side, inbetween OBSR & RCS..maybe. Small. Only 16 microns/sec on OBSR.
Not what I meant at all. For goodness sakes, we all know I can barely handle GEE, lol!
You take all the time you need to get up to speed. If you need a test problem, I have an event I can't find an epicenter for.....
I just meant that I was jealous because I like new toys. Have fun,
ETA: Hey TrueAmerican, any chance you can look at STAR, RCS, and RCM at 19:25:35 UTC? Is that under the mountain, or farther away. I'm currently looking farther out.. Thanks
edit on 1/22/2012 by Olivine because: to ask a question
Looking at amplitudes, it looks like it was probably on the north side, inbetween OBSR & RCS..maybe. Small. Only 16 microns/sec on OBSR.
edit
on 1/22/2012 by Olivine because: (no reason given)
lol, oh jeez, just saw you edited your post with the questions... Please don't. Not yet. I can barely even manage to get this thing working, much
less make judgements on what I see! YET.
I'm working on it though. But Ok, I confess I took a look, and it does seem to contain both the lower and higher frequencies associated with a seismic event. BUT: Disclaimer- I know nothing all over again, as I get up to speed with this. If you really want to know, best ask PuterMan.
I'm working on it though. But Ok, I confess I took a look, and it does seem to contain both the lower and higher frequencies associated with a seismic event. BUT: Disclaimer- I know nothing all over again, as I get up to speed with this. If you really want to know, best ask PuterMan.
lol, ok, maybe this wasn't such a good idea. I am lost in a sea of settings. But already I am seeing things I have a lot of questions about. Like what
I saw go by at STAR a while ago. At this point I've managed to achieve running spectrographs that are aligned with the waveforms like we see in GEE.
So I am literally watching a constant spectral analysis, for each station I choose to set up that way. And I saw a running burst that lasted for 5
minutes or so, but here's the kicker: very hot amplitudes across the board, while yet the waveform itself just appeared as normal background noise
floor. And I am talking down to 1 Hz or lower. What does it mean? I am NOT about to speculate.
Monitoring a volcano under an icecap has got to be one of the most difficult challenges there is for seismologists. Cause there is so much going on up there. Right now wind is kicking fiercely at Rainier, and particularly at higher elevations. It could be affecting the icecap, causing it to move, which would in turn generate frequencies normally only associated with seismicity. And that's just ONE problem. Then we have the problem of varying seismic wave speeds, as they propagate through different rock types, and ice as well. All changing the speeds of the waves being received. Jesus. I can see I am going to have to be extremely careful with this.
I claim student status for the next three months at least. So take anything I say with a grain of salt. Just not sure. I'm gonna be a lot more sure one day though.
And there's more. The ice at Rainier is very fractured in some places, with huge crevices that form in it. Heck, just ask the Rainier climbers, they'll tell ya. But these huge crevices can be seen in pictures, in a search for Rainier on google. The crevices in themselves are an additional problem. The decoupling effect of a huge crevice in the ice reduces the speed of that portion of the wave that passes through it. In fact, some of those crevices are big enough, with such a large gap, that in theory, the crevice should completely stop dead that portion of the wave trying to travel through it. Because there is nothing to propagate the wave there!
So there is probably considerable blurring of the signals, as part of the waves reach stations before other parts of the wave that have been badly refracted, or lost, as above, and slowed down from the crevices.
:shk:
What a fricken MESS.
ETA: and now I see why not speculating was a good idea: The current settings of the spectrograph are to display dynamic, logarithmic amplitude. So what I saw at STAR was merely a big glimpse into the frequency content of background noise.... :shk: Ok....That's it. Breaktime...
Monitoring a volcano under an icecap has got to be one of the most difficult challenges there is for seismologists. Cause there is so much going on up there. Right now wind is kicking fiercely at Rainier, and particularly at higher elevations. It could be affecting the icecap, causing it to move, which would in turn generate frequencies normally only associated with seismicity. And that's just ONE problem. Then we have the problem of varying seismic wave speeds, as they propagate through different rock types, and ice as well. All changing the speeds of the waves being received. Jesus. I can see I am going to have to be extremely careful with this.
I claim student status for the next three months at least. So take anything I say with a grain of salt. Just not sure. I'm gonna be a lot more sure one day though.
And there's more. The ice at Rainier is very fractured in some places, with huge crevices that form in it. Heck, just ask the Rainier climbers, they'll tell ya. But these huge crevices can be seen in pictures, in a search for Rainier on google. The crevices in themselves are an additional problem. The decoupling effect of a huge crevice in the ice reduces the speed of that portion of the wave that passes through it. In fact, some of those crevices are big enough, with such a large gap, that in theory, the crevice should completely stop dead that portion of the wave trying to travel through it. Because there is nothing to propagate the wave there!
So there is probably considerable blurring of the signals, as part of the waves reach stations before other parts of the wave that have been badly refracted, or lost, as above, and slowed down from the crevices.
:shk:
What a fricken MESS.
edit on Sun Jan 22nd 2012 by TrueAmerican because: (no reason given)
ETA: and now I see why not speculating was a good idea: The current settings of the spectrograph are to display dynamic, logarithmic amplitude. So what I saw at STAR was merely a big glimpse into the frequency content of background noise.... :shk: Ok....That's it. Breaktime...
edit on
Sun Jan 22nd 2012 by TrueAmerican because: (no reason given)
reply to post by TrueAmerican
True Amercian - This is just awesome = Cheers to you!!! Am I to assume that you obtained these instruments because you are that good and They need help?? :-) Time also to see if you can get Puterman on board me thinhs - only because the both of you are on spot - me thinks - and have for some time = They come here for our watches because we are on top of it - and - they don't have the funding to watch like we do. ---- Awesome!!!!
True Amercian - This is just awesome = Cheers to you!!! Am I to assume that you obtained these instruments because you are that good and They need help?? :-) Time also to see if you can get Puterman on board me thinhs - only because the both of you are on spot - me thinks - and have for some time = They come here for our watches because we are on top of it - and - they don't have the funding to watch like we do. ---- Awesome!!!!
edit on 22-1-2012 by Anmarie96 because: (no reason given)
Posted as another post so as not to get lost in the last
Think ---- I run my ice cube tray under hot water to free the cubes - in doing this, you can hear and feel the ice begin to break free - there is something to this!
Think ---- I run my ice cube tray under hot water to free the cubes - in doing this, you can hear and feel the ice begin to break free - there is something to this!
Anmarie96, I love your analogy. To me, it makes perfect sense.
The folks at the Pacific Northwest Seismic Network are still convinced that the multiplet activity is weather/glacier related, as evidenced by their latest blog entry .
I don't know. They're the experts. But their graphs end on the 21st, when the storm did. It is clear skies on the mountain this morning Rainier mountain cam--click the mountain link, yet the multiplet activity seems to have continued on; maybe even increased slightly.
Oh yeah, there was a nice little Mag 2.01.9 just south and west of St. Helens this morning.
Source
The folks at the Pacific Northwest Seismic Network are still convinced that the multiplet activity is weather/glacier related, as evidenced by their latest blog entry .
I don't know. They're the experts. But their graphs end on the 21st, when the storm did. It is clear skies on the mountain this morning Rainier mountain cam--click the mountain link, yet the multiplet activity seems to have continued on; maybe even increased slightly.
Oh yeah, there was a nice little Mag
edit on 1/23/2012 by Olivine because: earthquake downgraded (2nd time--it began life
as a mag 2.2
new topics
-
To become president, Zelensky had to learn Ukrainian
Political Conspiracies: 5 hours ago -
Green Grapes
General Chit Chat: 9 hours ago
top topics
-
S.C. Jack Smith's Final Report Says Trump Leads a Major Conspiratorial Criminal Organization!.
Political Conspiracies: 16 hours ago, 11 flags -
Advice for any young Adult .
General Chit Chat: 17 hours ago, 10 flags -
Green Grapes
General Chit Chat: 9 hours ago, 6 flags -
To become president, Zelensky had to learn Ukrainian
Political Conspiracies: 5 hours ago, 5 flags -
Those Great Fresh Pet Commercials
Television: 14 hours ago, 3 flags
active topics
-
To become president, Zelensky had to learn Ukrainian
Political Conspiracies • 5 • : Dalamax -
Los Angeles brush fires latest: 2 blazes threaten structures, prompt evacuations
Mainstream News • 120 • : Lazy88 -
Gravitic Propulsion--What IF the US and China Really Have it?
General Conspiracies • 37 • : Lazy88 -
The Truth about Migrant Crime in Britain.
Social Issues and Civil Unrest • 34 • : angelchemuel -
Russia Ukraine Update Thread - part 3
World War Three • 6905 • : Arbitrageur -
Planned Civil War In Britain May Be Triggered Soon
Social Issues and Civil Unrest • 22 • : Freeborn -
Labour Plotting to Postpone May's Council Elections ?
Regional Politics • 21 • : angelchemuel -
What Comes After January 20th
Mainstream News • 34 • : charlest2 -
Some sausage, some chicken, some sauce, some onions and some garlic...and some peppers!
Food and Cooking • 4 • : putnam6 -
S.C. Jack Smith's Final Report Says Trump Leads a Major Conspiratorial Criminal Organization!.
Political Conspiracies • 42 • : WeMustCare