It looks like you're using an Ad Blocker.
Please white-list or disable AboveTopSecret.com in your ad-blocking tool.
Thank you.
Some features of ATS will be disabled while you continue to use an ad-blocker.
share:
reply to post by dreamingawake
I am somewhat surprised that Earthquake Report have not revised. Maybe they go from the EMSC data - that is quite possible.
Having checked their site thoroughly it seems they use USGS. Maybe the only go on the initial RSS feed or something. If they are using USGS they should follow through with the changes. EMSC still has 6.9 but that may change after the weekend.
edit on 3/3/2012 by PuterMan because: (no reason given)
Originally posted by PuterMan
Just thought ye all might like.
Oh yeah, thanks! So.....what does this tell us besides more energy? Anything?
reply to post by MamaJ
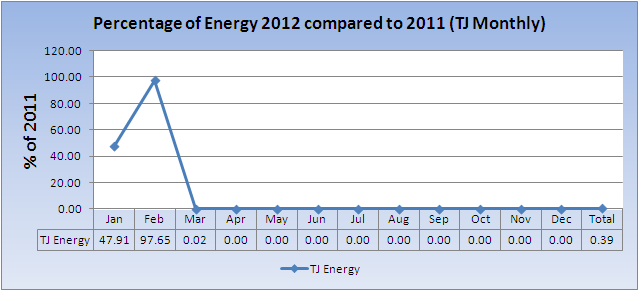
No it is not saying MORE energy it is saying LESS. The figures are the percentage each month of the 2011 value so in January there was only 47% as much energy released ans in Jan 2011. In Feb nearly 98% or almost the same amount and so far in March just 0.02%.
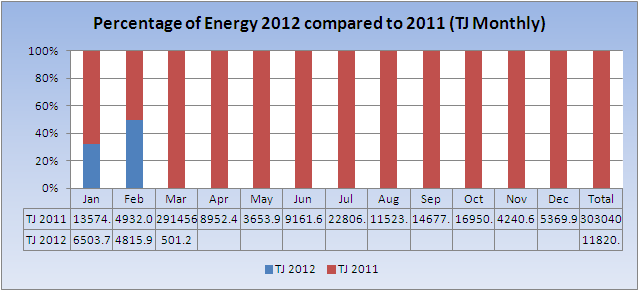
Here, have a different style that might be easier to understand. The complete column is the total (red) and the blue is the percentage of that in 2012.

edit on 3/3/2012 by PuterMan because: (no reason given)
reply to post by PuterMan
LMAO your reply to diamondsmith was funny then i scrolled down LOL.
No i have a strange theory or feeling that the ten days before perigee show an unusual spike in quake activity. unusual compared to what you may ask.
well I tried to come up with numbers and graphs to show why I think such a theory, but as you know there are so many variables and no real pattern of quakes to compare to other than our very short recorded history.. so I have come to the conclusion that my 10 day before perigee theory is just a feeling based on my observations,
like the feeling I got before the Japan quake last year, I have been observing geology and earthquakes for most of my life but the last 2 years I have made it a point to check the activity daily compared to the perigees and just take that info in to make a hypothesis or guess it could be I am making a pattern up or I noticed something that really is having an effect on quake activity.
I must say with the perigees and activity this year I am seeing/feeling what i felt last year.
I can say when But to find the where I just look at the earths current EQ activity and just like japan last year look for a similar rise in activity, the more average to larger quakes 4.0 to 6.0 i would say start showing up the 10days before. the ten days before is not exact and I am just using that as my average.
this months max perigee is on march 10. next is Apr 7, but what i am watching closely for is the 10 days before May 6 this years Maximum Perigee which is not as close as last years sensationally title supermoon.
I dont like to guess on location because I feel the whole world is at risk but if I had to guess I would say Western americas coast of the ring of fire is experiencing the tension this year as time gets closer we should be able to pin point more activity.
yes this is just my feeling from my observations but last year if I would have been more active about my theory I might have been able to help in some way. I think it was 3weeks before the march 11 Japan quake I posted a thread about the supermoon and had this worry it wasn't until a few months after that I noticed the 10days.
this is an interesting article.
Five-magnitude earthquake strikes off Kamchatka Peninsula
kinda interesting to see a prediction one month in advance especially from Seismologists. the article does not say what seismologist's say this or where the experts are from but it is interesting.
Five-magnitude earthquake strikes off Kamchatka Peninsula
Seismologists say a 7-magnitutude earthquake is likely in this area within a month. If its center is in the Vacha Bay, the strength of tremors in Petropavlovsk-Kamchatsky may reach 5-6 points.
kinda interesting to see a prediction one month in advance especially from Seismologists. the article does not say what seismologist's say this or where the experts are from but it is interesting.
reply to post by -W1LL
What you thought you were going to get away with it? lol I quite liked the idea of waiting for the next big brass band competition.
We do have 110 or so years of reasonably good data at least for mag 7, and around 70 years for mag 5.5. Is that nor enough to find a pattern? Maybe not I don't know. I would agree that some of the solar patterns fall outside this time frame.
My interest here lies in the statement about this year's activity. You see it really is in no way similar to last year as far as I can see. But maybe I am not seeing what you are?
Taking the global view as anything else is just too time consuming, the number of earthquakes last year mag 4.5+ to the end of Feb was about 660 and there seemed to be more activity in January than February,
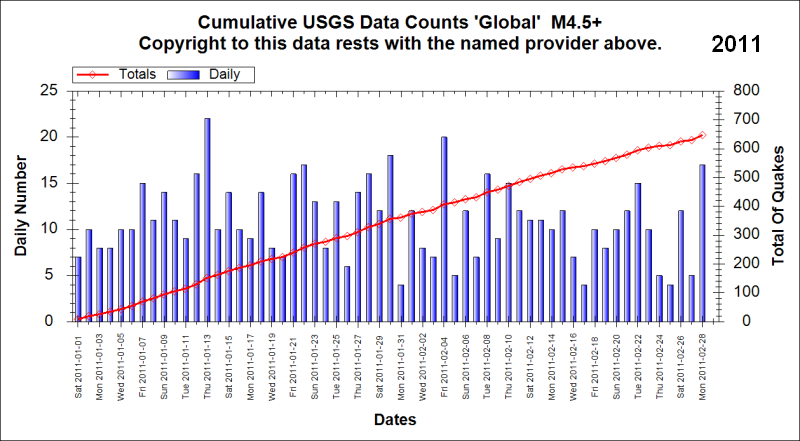
By comparison in 2010 there were 820 quakes Mag 4.5+ and the totals are definitely weighted towards the end of February. So this is about 24% more earthquakes this year than last by the same time.
But as I always say for the most part numbers do not matter.
The cumulative energy for the first 2 months of 2011, mag 4.5+ was about 18,500 TJ
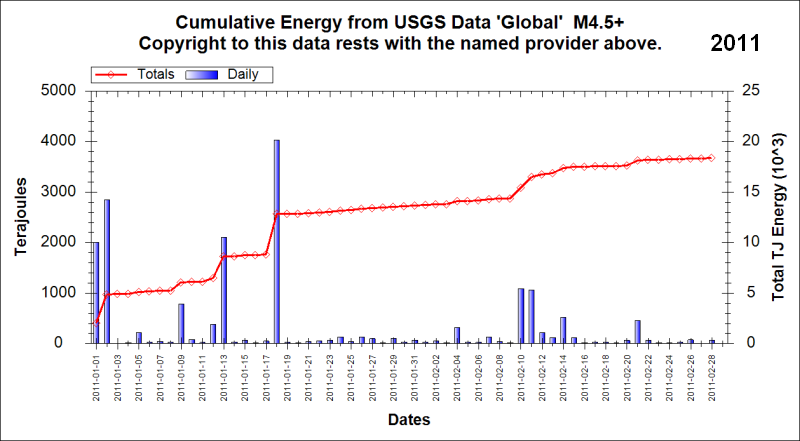
But this year, with 24% more quakes, the energy was just 14,000 TJ - substantially less. If the rate had been the same quake for quake then that should have been 15,787 TJ. Putting it another way the energy so far this year has been only about 50% of what it should have been for the number of earthquakes based on 2011 per quake energy.
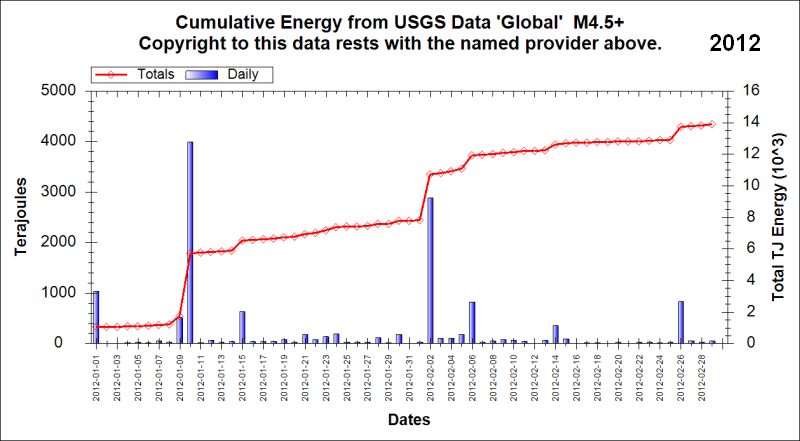
This was the case in 2008 as well when for the whole year the count of numbers was quite high, yet the total energy for the year was the lowest in the decade.
I can pull up lists for Mag 5+ daily numbers for any year back to around 1970 from the data I have in my database so if that is any help let me know.
And note that on the occasion of the 'supermoon' Mother Nature decided to put the Earthquakes on rest time as if to make a rude gesture to the doomsayers.
Not saying you may not have a theory, but you need to be able to plug some data in there and get some tables and graphs going.
What you thought you were going to get away with it? lol I quite liked the idea of waiting for the next big brass band competition.
but as you know there are so many variables and no real pattern of quakes to compare to other than our very short recorded history..
We do have 110 or so years of reasonably good data at least for mag 7, and around 70 years for mag 5.5. Is that nor enough to find a pattern? Maybe not I don't know. I would agree that some of the solar patterns fall outside this time frame.
I must say with the perigees and activity this year I am seeing/feeling what i felt last year.
I can say when But to find the where I just look at the earths current EQ activity and just like japan last year look for a similar rise in activity, the more average to larger quakes 4.0 to 6.0 i would say start showing up the 10days before. the ten days before is not exact and I am just using that as my average.
My interest here lies in the statement about this year's activity. You see it really is in no way similar to last year as far as I can see. But maybe I am not seeing what you are?
Taking the global view as anything else is just too time consuming, the number of earthquakes last year mag 4.5+ to the end of Feb was about 660 and there seemed to be more activity in January than February,

By comparison in 2010 there were 820 quakes Mag 4.5+ and the totals are definitely weighted towards the end of February. So this is about 24% more earthquakes this year than last by the same time.
But as I always say for the most part numbers do not matter.
The cumulative energy for the first 2 months of 2011, mag 4.5+ was about 18,500 TJ

But this year, with 24% more quakes, the energy was just 14,000 TJ - substantially less. If the rate had been the same quake for quake then that should have been 15,787 TJ. Putting it another way the energy so far this year has been only about 50% of what it should have been for the number of earthquakes based on 2011 per quake energy.

This was the case in 2008 as well when for the whole year the count of numbers was quite high, yet the total energy for the year was the lowest in the decade.
I can pull up lists for Mag 5+ daily numbers for any year back to around 1970 from the data I have in my database so if that is any help let me know.
this months max perigee is on march 10. next is Apr 7, but what i am watching closely for is the 10 days before May 6 this years Maximum Perigee which is not as close as last years sensationally title supermoon.
And note that on the occasion of the 'supermoon' Mother Nature decided to put the Earthquakes on rest time as if to make a rude gesture to the doomsayers.
Not saying you may not have a theory, but you need to be able to plug some data in there and get some tables and graphs going.
Magnitude mb 5.4
Region WEST OF BONIN ISLANDS
Date time 2012-03-03 18:29:27.7 UTC
Location 27.19 N ; 136.59 E
Depth 33 km
Distances 725 km SE Miyazaki (pop 311,203 ; local time 03:29:27.7 2012-03-04)
671 km SE Nishinoomote (pop 17,832 ; local time 03:29:27.7 2012-03-04)
EMSC
Originally posted by -W1LL
this is an interesting article.
Five-magnitude earthquake strikes off Kamchatka Peninsula
Seismologists say a 7-magnitutude earthquake is likely in this area within a month. If its center is in the Vacha Bay, the strength of tremors in Petropavlovsk-Kamchatsky may reach 5-6 points.
kinda interesting to see a prediction one month in advance especially from Seismologists. the article does not say what seismologist's say this or where the experts are from but it is interesting.
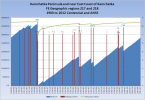
Very interesting. Thanks for that. I toddled off to do a stress calculation for the area after reading that. Now I am not sure how the FE 217 and FE 218 areas relate to what they were saying but I used both of them. Later when I get up to this region I can define that better. Based on those two areas the stress chart looks like this, and yes is showing the potential for a Mag 8+
reply to post by PuterMan
Based on the very approximate frequencies since 1900 the possibility of a mag 7+ seems to be around 108 months OVERDUE and the possibility of a mag 8+ is getting close to the periodic value of 678 as it is currently at 643 months. The problem is that with only 2 x Mag 8 in the 110 years it is not possible to say if the period is right as the second one could have been overdue. On the other hand if the first one was overdue - which could well have been then the Mag 8 period would be longer and thus not as close to the periodic value.
Based on the very approximate frequencies since 1900 the possibility of a mag 7+ seems to be around 108 months OVERDUE and the possibility of a mag 8+ is getting close to the periodic value of 678 as it is currently at 643 months. The problem is that with only 2 x Mag 8 in the 110 years it is not possible to say if the period is right as the second one could have been overdue. On the other hand if the first one was overdue - which could well have been then the Mag 8 period would be longer and thus not as close to the periodic value.
Magnitude ML 5.1
Region AEGEAN SEA
Date time 2012-03-04 03:31:08.4 UTC
Location 40.15 N ; 24.06 E
Depth 10 km
Distances 109 km SE Thessaloníki (pop 354,290 ; local time 05:31:08.4 2012-03-04)
92 km S Kavála (pop 59,240 ; local time 05:31:08.4 2012-03-04)
9 km NE Sárti (pop 1,258 ; local time 05:31:08.4 2012-03-04)
EMSC
Magnitude mb 4.7
Region WESTERN MEDITERRANEAN SEA
Date time 2012-03-04 03:47:40.5 UTC
Location 41.99 N ; 7.66 E
Depth 7 km
Distances 159 km NW Sassari (pop 125,747 ; local time 04:47:40.5 2012-03-04)
89 km W Ajaccio (pop 54,364 ; local time 04:47:40.5 2012-03-04)
78 km W Cargèse (pop 1,032 ; local time 04:47:40.5 2012-03-04)
EMSC
I'm working on my linking, but I still haven't been able to get it just yet.( I've got one kid nailed to the floor here but he's fighting it. LOL)
I was wondering if anyone could take a look at the ceri helicorder for Pemiscot Bayou, Mo. It looks to me like little tremblors, but since I'm still
learning how to read the helicorders I don't trust myself. USGS has not posted anything, but we all know that doesn't mean much lately.
Thanks in advance.
Crappiekat
Thanks in advance.
Crappiekat
reply to post by crappiekat
Those show much better on PVMO which is a bit further away and is a 40 sps instrument as opposed to 100 sps - assuming that they are the same thing. PVMO.NM..BHZ.2012.063
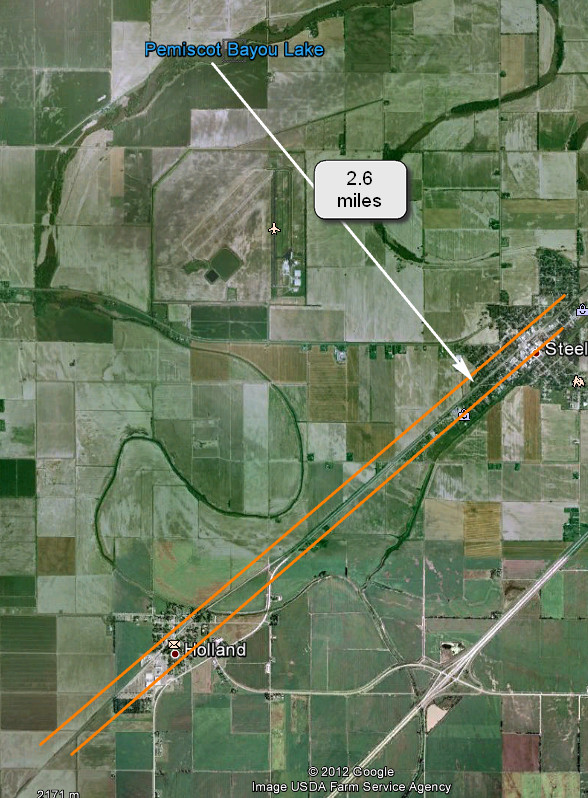

(1st March)
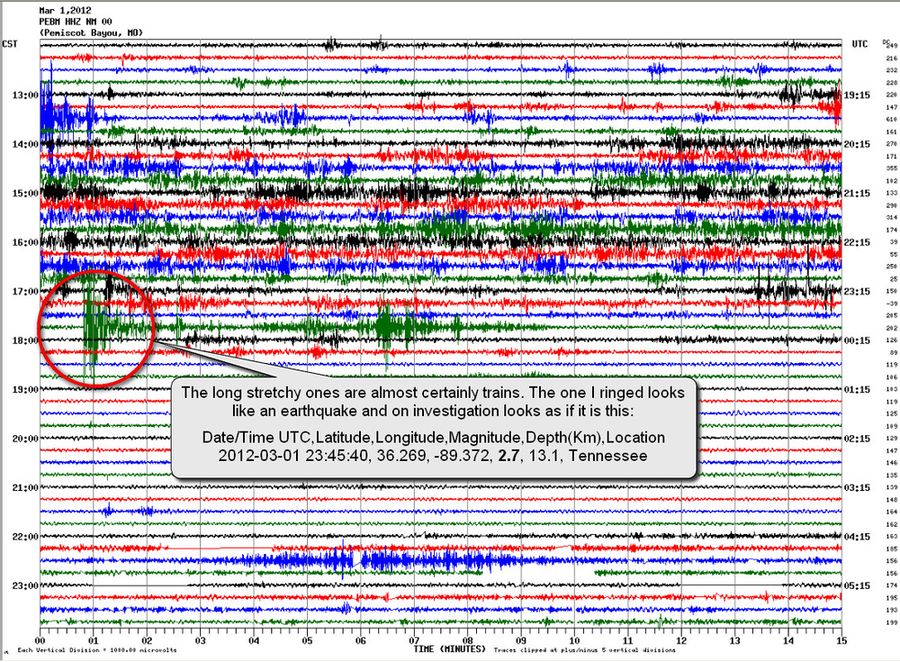
ETA: Some of the small blips (29 Feb) look like they could be lightening and the slightly longer small ones could be vehicular traffic.
Those show much better on PVMO which is a bit further away and is a 40 sps instrument as opposed to 100 sps - assuming that they are the same thing. PVMO.NM..BHZ.2012.063


(1st March)

edit on 4/3/2012 by PuterMan because: To add the big picture
ETA: Some of the small blips (29 Feb) look like they could be lightening and the slightly longer small ones could be vehicular traffic.
edit on 4/3/2012 by PuterMan because: (no reason given)
reply to post by PuterMan
Thank you Puterman for checking those out for me. Well the ones I was really looking at were on 3/3/12. USGS has nothing for that day, however their were two that happened in the same area except, 3/4/12 according to USGS.
Thank you Puterman for checking those out for me. Well the ones I was really looking at were on 3/3/12. USGS has nothing for that day, however their were two that happened in the same area except, 3/4/12 according to USGS.
This one was felt.
source(earthquake.usgs.gov...
Magnitude 5.2
Date-Time Monday, March 05, 2012 at 07:41:06 UTC Monday, March 05, 2012 at 01:11:06 PM at epicenter
Location 28.808°N, 76.772°E
Depth 19.1 km (11.9 miles) Region HARYANA - DELHI REGION, INDIA
Distances 48 km (30 miles) WNW (296°) from NEW DELHI, Delhi, India 93 km (58 miles) WSW (257°) from Meerut, Uttar Pradesh, India 143 km (89 miles) N (7°) from Alwar, Rajasthan, India
Location Uncertainty horizontal +/- 16.2 km (10.1 miles); depth +/- 6.7 km (4.2 miles) Parameters NST=109, Nph=111, Dmin=970.7 km, Rmss=1.16 sec, Gp= 58°, M-type=body wave magnitude (Mb), Version=7
This one is to fresh to say.
source(www.emsc-csem.org...
Magnitude mb 6.1
Region SANTIAGO DEL ESTERO, ARGENTINA
Date time 2012-03-05 07:46:08.1 UTC
Location 28.34 S ; 63.33 W
Depth 537 km
Distances 111 km SE Santiago del estero (pop 354,692 ; local time 04:46:08.1 2012-03-05) 332 km SW Presidencia roque sáenz peña (pop 81,879 ; local time 04:46:08.1 2012-03-05)
new topics
-
Spiritual Solstice
Short Stories: 1 hours ago -
'Mass Casualty event' - Attack at Christmas market in Germany
Mainstream News: 11 hours ago
top topics
-
'Mass Casualty event' - Attack at Christmas market in Germany
Mainstream News: 11 hours ago, 26 flags -
Biden Nationalizes Another 50,000+ Student Loans as He Heads for the Exit
US Political Madness: 16 hours ago, 8 flags -
Search to Resume for MH 370
Disaster Conspiracies: 13 hours ago, 5 flags -
Sue Gray, Sir Keir Starmer's former Chief of Staff, Nominated for Peerage
Regional Politics: 15 hours ago, 3 flags -
Spiritual Solstice
Short Stories: 1 hours ago, 0 flags
active topics
-
'Mass Casualty event' - Attack at Christmas market in Germany
Mainstream News • 99 • : BrucellaOrchitis -
Search to Resume for MH 370
Disaster Conspiracies • 8 • : charlyv -
Spiritual Solstice
Short Stories • 2 • : Naftalin -
Mood Music Part VI
Music • 3752 • : BrucellaOrchitis -
An Interesting Conversation with ChatGPT
Science & Technology • 31 • : BrucellaOrchitis -
Why isn't Psychiatry involved?
Social Issues and Civil Unrest • 28 • : BrucellaOrchitis -
Smartest Man in the World Tells His Theory About What Happens At Death
Philosophy and Metaphysics • 51 • : whereislogic -
Drones everywhere in New Jersey ---and Elsewhere Master Thread
Aliens and UFOs • 205 • : GENERAL EYES -
-@TH3WH17ERABB17- -Q- ---TIME TO SHOW THE WORLD--- -Part- --44--
Dissecting Disinformation • 3771 • : 777Vader -
Democrat Governors Hold Emergency Meeting With President Biden to Assess His Mental State.
2024 Elections • 119 • : TruthJava

