It looks like you're using an Ad Blocker.
Please white-list or disable AboveTopSecret.com in your ad-blocking tool.
Thank you.
Some features of ATS will be disabled while you continue to use an ad-blocker.
share:
“ Super earthquakes in Cascadia are nature’s equivalent to the World Trade Center disaster. But the potential losses are so much larger
that they will affect the social fabric of the entire Northwest and dramatically alter the US and world economy.”
– Robert Yeats, Author “Living with Earthquakes” PhD., Oregon State University
The PACIFIC OCEAN's maximam length is 9,000 miles and it's greatest width is 11,000 miles wide.
FOX Headline "Caps, Timbers square off in Cascadia Cup tilt" - 9/15/2012, first ever nationally televised match. Olympics - felled timber flooring in the 'satanic mills' decimated post-apocalypse: Paralympics worship of earth, wind, water and fire. Prominent volcano.
Last week's media headlines "Yellowstone Megavolcano May Blow Without Warning", all implying that some other event may lead to a sudden eruption. Olympics volcano, fire.
The Ring of fire is lit up because they are signalling it as the global 9/11 event. Today is 555 days since Fukushima. In occult terms, 9/15/2012 = 5555.
These are lying signs and wonders. The world is erupting in chaos. Global 9/11. Prepare, they have stamped their occult symbology everywhere for us to see.
reply to post by dreamfox1
This is a 'swarm' that has been going on at El Hierro for a couple of days now. From what I can find it is magma movement, might be or might not be getting ready for another little growth spurt offshore.
Rainbows
Jane
This is a 'swarm' that has been going on at El Hierro for a couple of days now. From what I can find it is magma movement, might be or might not be getting ready for another little growth spurt offshore.
Rainbows
Jane
El Heirro has been ongoing for months - it all started off as an underwater eruption, as in 'island forming'. Not too sure if anything has changed
much but its deffo not new.
You can follow the whole story from Earthquake Report
You can follow the whole story from Earthquake Report
edit on 15/9/12 by Kellys because: added link
reply to post by Aircooled
Hi Aircooled. I think your first thought that it was a glitch is correct.
My guess is that it was a false alarm triggered by this Mag 6.2 at 04:51:47 in Indonesia. If you go to the technical page and click the estimated P-wave travel times, it is very close.
There was a small microquake in central Maryland a few hours ago. Mag 2.1
It was reportedly felt by 17 people, but I wasn't one of them. I'm some 60 miles away and was fast aslumber.
edit on 9/15/2012 by Olivine
because: add a quake
Magnitude ML 3.2
Region ENGLISH CHANNEL
Date time 2012-09-15 14:25:13.7 UTC
Location 50.26 N ; 0.99 E
Depth 2 km
Distances 160 km SE London (pop 7,421,209 ; local time 15:25:13.7 2012-09-15)
77 km SE Eastbourne (pop 112,906 ; local time 15:25:13.7 2012-09-15)
37 km NW Dieppe (pop 35,707 ; local time 16:25:13.7 2012-09-15)
35 km NW Mers-les-bains (pop 3,487 ; local time 16:25:13.7 2012-09-15)
Source parameters provided by another agency
EMSC
probably just another WWII mine going off!
Rainbows
Jane
reply to post by angelchemuel
at the equivalent of 951.5kg of TNT that could cause some damage!
hopefully no basking whales in the vicinity
how did it get 2km down though?
at the equivalent of 951.5kg of TNT that could cause some damage!
hopefully no basking whales in the vicinity
how did it get 2km down though?
Am looking at Japan today, updating a months worth of backlog.
Needed a break so thought I'd check on the previous 24 hours (15th Sept UTC) Mag 3+
I now have 2 sources, NIED (JMA feeder) and QVS DataPro (scraping JMA)
2 different answers
One of the reasons I changed to 50% opacity icons recently was so that you could see doubles and overlaps when comparing two different sources, it was for USGS/EMSC/GFZ/RAS originally but can be used for any comparison. Where locations match the icons are on top of each other and come out on the maps darker ( 100% opacity)
heres the map showing the two sources data
goo.gl...
here are the events (colours show matches, white text has no match)
JMA Offical Earthquakes within the last week www.jma.go.jp...
WHEN, LAT, LONG, DEPTH, MAG, WHERE
[color=3BB9FF]15/09/2012 22:11:00, 35, 138.1, 30, 3.6, Shizuoka-ken Chubu
15/09/2012 21:55:00, 35.8, 141, 10, 3.2, Chiba-ken Toho-oki
[color=C45AEC]15/09/2012 16:17:00, 37, 138.6, 10, 3.5, Niigata-ken Chuetsu-chiho
[color=5EFB6E]15/09/2012 16:09:00, 35.8, 141.1, 10, 4.5, Chiba-ken Toho-oki
[color=FBB117]15/09/2012 03:24:00, 36.2, 137.7, 10, 3.0, Nagano-ken Chubu
[color=FFFF00]15/09/2012 00:14:00, 38.8, 142.6, 20, 3.9, Miyagi-ken Oki
Preliminary Catalog by the Hi-net Automatic System (registered users only)
WHEN, LAT, LONG, DEPTH, MAG, WHERE
15/09/2012 22:57:50, 43.044, 145.0795, 77.9, 3.4, Hokkaido Prefecture, Akkeshi District, Hamanaka, Biwase
[color=3BB9FF ]15/09/2012 22:11:06, 35.0097, 138.1029, 30, 3.7, Shizuoka Prefecture, Haibara District, Kawanehon, Shimoizumi
15/09/2012 20:46:54, 37.4166, 141.966, 11.4, 3.0, Japan
[color=C45AEC]15/09/2012 16:17:32, 37.0454, 138.6203, 11.7, 3.5, Niigata Prefecture, Tokamachi
15/09/2012 16:12:44, 38.4038, 140.2549, 159.8, 3.0, Yamagata Prefecture, Sagae, Hiwada
[color=5EFB6E]15/09/2012 16:09:47, 35.7582, 140.9018, 27.6, 4.3, Chiba Prefecture, Choshi, Kurohaicho
15/09/2012 13:05:51, 39.9183, 142.4428, 35.8, 3.5, Japan
15/09/2012 11:15:48, 36.9031, 141.3103, 42.7, 3.2, Japan
15/09/2012 08:04:27, 39.4738, 142.4924, 25.3, 3.4, Japan
15/09/2012 07:49:29, 41.8515, 142.9309, 48.7, 3.3, Japan
[color=FBB117]15/09/2012 03:24:52, 36.2527, 137.7019, 6.6, 3.0, Nagano Prefecture, Matsumoto, Azumi
15/09/2012 00:16:16, 30.2945, 129.9096, 215.2, 3.9, Japan
[color=FFFF00]15/09/2012 00:14:16, 38.8209, 142.5611, 20.9, 3.8, Japan
I'm guessing they are selective about which ones to review and publish, just like the new NZ Geonet site, but here also there doesn't seem any prescribed parameters to review them, its hit and miss, you would think they would have a quick look at a 3.9 for example, or have a minimum review magnitude, like 3.0 or 3.5 or whatever.
Anyway its posted here now and saved for review again in 4-5 days when JMA put out the JMA unified hypocenter catalog for the 15th.
edit on 15-9-2012 by muzzy because: (no reason given)
The Puerto Rico area keeps popping, and I continued thinking, "meh, that's normal for this area".
But I'm not at all certain this is 'normal'.
Over the past 30 days, according to USGS there have been 850 earthquakes magnitude 2.5 and larger in this region. Out of 2041 globally, that is 41.6% of the worldwide quakes M2.5 and larger.
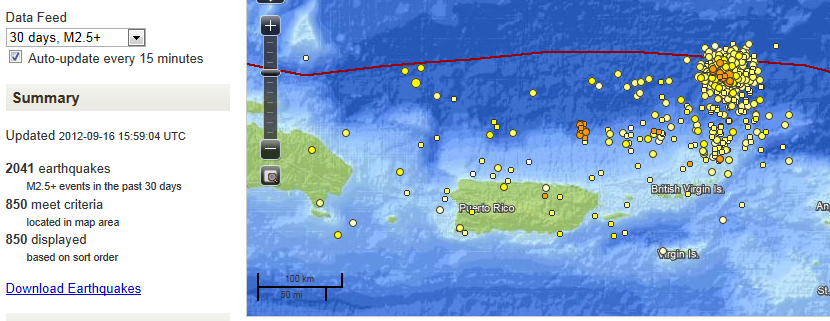
(scroll right to see swarm areas)
(click on USGS link above, then PR link near top of map, set to Mag 2.5+, past 30 days)
Do you think that this swarm has released sufficient energy to forestall a major rupture?
What is the largest potential Magnitude quake thought to be possible in this area?
I'm not familiar with the tectonics of the area, but I'm off to do some reading.
But I'm not at all certain this is 'normal'.
Over the past 30 days, according to USGS there have been 850 earthquakes magnitude 2.5 and larger in this region. Out of 2041 globally, that is 41.6% of the worldwide quakes M2.5 and larger.

(scroll right to see swarm areas)
(click on USGS link above, then PR link near top of map, set to Mag 2.5+, past 30 days)
Do you think that this swarm has released sufficient energy to forestall a major rupture?
What is the largest potential Magnitude quake thought to be possible in this area?
I'm not familiar with the tectonics of the area, but I'm off to do some reading.
edit on 9/16/2012 by Olivine because:
formatting
edit on 9/16/2012 by Olivine because: more tweaking
reply to post by angelchemuel
I noticed that one too, there was no mention I could find in the u.k news. But I'm never taking the chunnel again.
I noticed that one too, there was no mention I could find in the u.k news. But I'm never taking the chunnel again.
Look on the most recent updates at the global volcanism website(s). They coinside with the earthquakes. Lots of volcanic unrest.
reply to post by Olivine
Since 01/01/2009 USGS data for the area Lat 18.75 to Lat 20.25 and Lon -65 to Lon -63 which is basically this
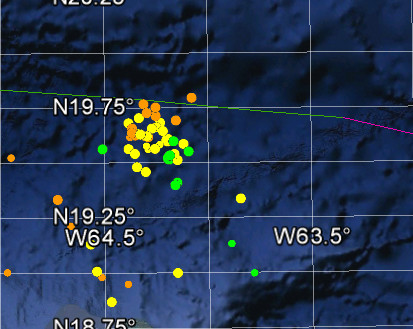
there has been a steadyish succession of earthquakes since 01/01/2009. The current swarm is definitely out of the ordinary in that time period
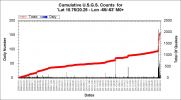
Using the ANSS catalogue since 1963 there have been 428 events in that same 'box' over magnitude 4.0
The largest event from then to now in that area was a mag 6.1 which was at 10:40 on 11 October 2008. The next largest event was a Mag 6 17 October 2001 @ 11:29 and then it drops to Mag 5.6 of which there was on n October 2001 and one in March 2003 and one in June 1985.
Unfortunately I cannot do a timeline of these because that part of my program is bust and it just takes too long to do it manually.
2 holes through the way and a meal later, here is the 30 day period you mentioned. Looks as if it has done it's thing for the time being. (This is the very last part of that other chart)
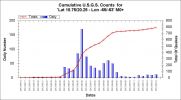
Since 01/01/2009 USGS data for the area Lat 18.75 to Lat 20.25 and Lon -65 to Lon -63 which is basically this

there has been a steadyish succession of earthquakes since 01/01/2009. The current swarm is definitely out of the ordinary in that time period

Using the ANSS catalogue since 1963 there have been 428 events in that same 'box' over magnitude 4.0
The largest event from then to now in that area was a mag 6.1 which was at 10:40 on 11 October 2008. The next largest event was a Mag 6 17 October 2001 @ 11:29 and then it drops to Mag 5.6 of which there was on n October 2001 and one in March 2003 and one in June 1985.
Unfortunately I cannot do a timeline of these because that part of my program is bust and it just takes too long to do it manually.
2 holes through the way and a meal later, here is the 30 day period you mentioned. Looks as if it has done it's thing for the time being. (This is the very last part of that other chart)

edit on 16/9/2012 by PuterMan because: (no reason given)
reply to post by angelchemuel
Most likely. 2000 lbs of HE according to Muzzy and NO mention of it on BGS, only by Les Frogslegs.
WWII ordinance for certain. No way BGS would have missed that.
probably just another WWII mine going off
Most likely. 2000 lbs of HE according to Muzzy and NO mention of it on BGS, only by Les Frogslegs.
WWII ordinance for certain. No way BGS would have missed that.
Originally posted by PuterMan
reply to post by angelchemuel
probably just another WWII mine going off
Most likely. 2000 lbs of HE according to Muzzy and NO mention of it on BGS, only by Les Frogslegs.
WWII ordinance for certain. No way BGS would have missed that.
Thanks to you Puters...I'm learning! Thank you.
Rainbows
Jane
reply to post by PuterMan
I am trying to learn too and I was glad to see that Olivine was on the same wavelength as I am. I am worried for that area. Over a year ago I noticed activity there and always keep watch on it since I am along the east coast of the US and it is relatively close. Lately I have had a bad feeling about the activity and this morning noticed a swarm which put me on high alert. Info on the area is helpful since I haven't got a clue.
I am trying to learn too and I was glad to see that Olivine was on the same wavelength as I am. I am worried for that area. Over a year ago I noticed activity there and always keep watch on it since I am along the east coast of the US and it is relatively close. Lately I have had a bad feeling about the activity and this morning noticed a swarm which put me on high alert. Info on the area is helpful since I haven't got a clue.
reply to post by rbkruspe
Hi, yes I just took a look at the activity for yesterday and today and it looks as if it is doing it's thing again, or was that a last gasp I wonder as there is nothing for UTC 17th so far.
Two possibilities there, either that was final flurry with 31 quakes yesterday and it will now fall back to the 'normal' pattern, or it got stuck and will be quiet until it burps a bigger one. It is not very likely to be a very big one anyway.
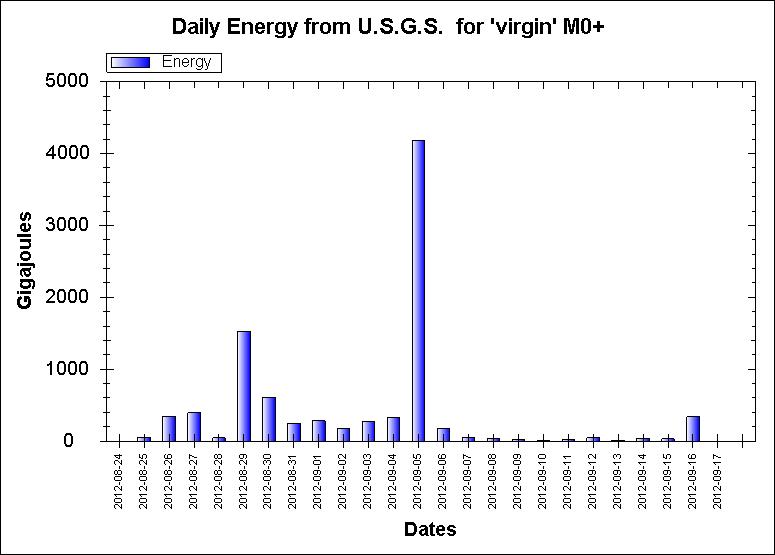
When all is said and done yesterday was pretty minor by comparison to earlier energy daily values so my feeling is that this was a last gasp and it is pretty much over. I have been known to be wrong however, at least I think I have
A bit of daily Virgin energy
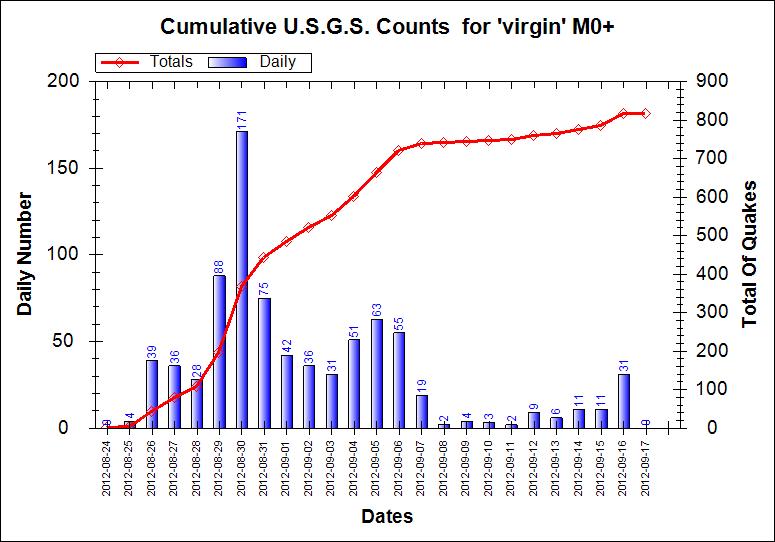
ETA: Here is a direct comparison giving the counts over the same time frame
Hi, yes I just took a look at the activity for yesterday and today and it looks as if it is doing it's thing again, or was that a last gasp I wonder as there is nothing for UTC 17th so far.
Two possibilities there, either that was final flurry with 31 quakes yesterday and it will now fall back to the 'normal' pattern, or it got stuck and will be quiet until it burps a bigger one. It is not very likely to be a very big one anyway.
When all is said and done yesterday was pretty minor by comparison to earlier energy daily values so my feeling is that this was a last gasp and it is pretty much over. I have been known to be wrong however, at least I think I have
A bit of daily Virgin energy

ETA: Here is a direct comparison giving the counts over the same time frame

edit on 17/9/2012 by PuterMan because: (no reason given)
It is 12:26 IST (11:26 UTC)
My system has just done an import but I don't seem to be getting anything after 09:04 UTC
From my USGS import log file.
Same with New Zealand
That may just be because they are asleep however.
The USGS one seem odd. Anyone else not getting USGS data? (Off the check the web site)
ETA: No the web site stops at 07:05 - even earlier.
Looks as if USGS at least is temporarily down.
EMSC is working
The first one on that list is the last on the USGS site and the 09:04 is the last on the feeds.
My system has just done an import but I don't seem to be getting anything after 09:04 UTC
[9/17/2012 12:25:33 PM] USGS Text ImportDataFile has started. (S:868FBCEC7FC532BE99A6)
[9/17/2012 12:25:33 PM] ak,10560826,1,"Monday, September 17, 2012 09:04:58 UTC",63.5461,-152.3755,2.3,5.30,11,"Central Alaska" (S:868FBCEC7FC532BE99A6)
[9/17/2012 12:25:33 PM] Latest date: 2012-09-17T09:04:58.000Z (S:868FBCEC7FC532BE99A6)
From my USGS import log file.
Same with New Zealand
[9/17/2012 12:25:43 PM] NEWZ ImportDataFile has started. (S06BBEE1C184471B3F62)
[9/17/2012 12:25:43 PM] Latest date: 2012-09-17T03:03:28.071Z (S06BBEE1C184471B3F62)
[9/17/2012 12:25:43 PM] GeoNet (NZ) ImportDataFile has ended. 250 records processed. (S06BBEE1C184471B3F62)
That may just be because they are asleep however.
The USGS one seem odd. Anyone else not getting USGS data? (Off the check the web site)
ETA: No the web site stops at 07:05 - even earlier.
Looks as if USGS at least is temporarily down.
EMSC is working
Prov,Date/Time UTC,Latitude,Longitude,Magnitude,Depth(Km),Location
emsc,2012-09-17 07:05:51, 38.684, 46.750, 4.3, 2.0, N.Western Iran
usgs,2012-09-17 07:05:52, 38.726, 46.717, 4.3, 10.0, N.Western Iran
usgs,2012-09-17 07:09:42, 38.837, -122.827, 1.5, 2.6, Northern California
emsc,2012-09-17 07:10:40, 45.024, 3.339, 3.0, 2.0, France
usgs,2012-09-17 07:32:11, 38.819, -122.803, 1.4, 3.1, Northern California
emsc,2012-09-17 07:33:30, 27.711, -17.999, 2.5, 23.0, Canary Isls. Spain Region
usgs,2012-09-17 07:46:29, 58.011, -155.769, 1.3, 0.1, Alaska Peninsula
emsc,2012-09-17 07:58:23, 35.899, 36.109, 2.0, 8.0, Syria
jma,2012-09-17 08:22:00, 39.100, 142.200, 4.1, 50.0, Iwate-Ken Oki
usgs,2012-09-17 08:26:00, 57.924, -155.913, 1.7, 0.5, Alaska Peninsula
usgs,2012-09-17 08:36:33, 59.875, -151.529, 1.6, 79.7, Kenai Peninsula. Alaska
usgs,2012-09-17 08:42:34, 61.509, -149.260, 2.4, 27.8, Southern Alaska
usgs,2012-09-17 08:45:31, 46.193, -111.882, 1.1, 0.1, Western Montana
jma,2012-09-17 08:50:00, 37.000, 138.600, 2.6, 10.0, Niigata-Ken Chuetsu-Chiho
emsc,2012-09-17 08:52:20, 39.364, 33.200, 1.5, 7.0, Central Turkey
emsc,2012-09-17 08:52:29, 37.265, 15.279, 2.0, 36.0, Sicily Italy
usgs,2012-09-17 09:04:18, 33.757, -116.988, 1.1, 6.9, Southern California
usgs,2012-09-17 09:04:58, 63.546, -152.375, 2.3, 5.3, Central Alaska
emsc,2012-09-17 09:27:19, 39.616, 29.459, 2.0, 6.0, Western Turkey
emsc,2012-09-17 11:07:59, 66.332, -18.761, 3.4, 4.0, Iceland Region
The first one on that list is the last on the USGS site and the 09:04 is the last on the feeds.
edit on 17/9/2012 by PuterMan because: (no reason given)
reply to post by PuterMan
You're right, Puterman. The most recent event for me is also 09:04:58 UTC Cantwell, Alaska.
Thank you for the heads up. And thanks for the "number of quakes graph--Puerto Rico". I always love your graphics.
Of course, once I posted about PR, all seems to have quieted down there--that's a good thing.
Source for above quote
It looks like the USGS and others have been studying the Puerto Rico area for a while, and are finding it difficult to conclude the hazards based on stress regimes. The tectonics are complex. The link above has good info.
From my reading, the authorities anticipate the region can produce at least a Mag 7.5 and probably over Mag 8.0. There is also significant tsunami threat from regional earthquakes and landslides north of the island.
Tsunami sirens were installed in April of this year--step in the right direction.
Ack!, I missed your post (2 up) with the energy figures. Very nice.
So do you think the swarm stopped, or is it the USGS feed?
Update:
USGS earthquake map seems to have caught up now
You're right, Puterman. The most recent event for me is also 09:04:58 UTC Cantwell, Alaska.
Thank you for the heads up. And thanks for the "number of quakes graph--Puerto Rico". I always love your graphics.
Of course, once I posted about PR, all seems to have quieted down there--that's a good thing.
Historically, other large earthquakes have also struck the area, such as one in 1787 (magnitude~8.1), possibly in the Puerto Rico Trench, and one in 1867 (magnitude~7.5) in the Anegada Trough (figure 1).
Source for above quote
It looks like the USGS and others have been studying the Puerto Rico area for a while, and are finding it difficult to conclude the hazards based on stress regimes. The tectonics are complex. The link above has good info.
From my reading, the authorities anticipate the region can produce at least a Mag 7.5 and probably over Mag 8.0. There is also significant tsunami threat from regional earthquakes and landslides north of the island.
Tsunami sirens were installed in April of this year--step in the right direction.
Ack!, I missed your post (2 up) with the energy figures. Very nice.
So do you think the swarm stopped, or is it the USGS feed?
edit on 9/17/2012 by Olivine because: missed some crucial info
Update:
USGS earthquake map seems to have caught up now
edit on 9/17/2012 by Olivine because: update
Hehehe...hey Puters...from BGS
2012/09/15 14:25:11.7 50.283 1.220 2.4 ENGLISH CHANNEL POSSIBLE EXPLOSION
Rainbows
Jane
2012/09/15 14:25:11.7 50.283 1.220 2.4 ENGLISH CHANNEL POSSIBLE EXPLOSION
Rainbows
Jane
M5.5 - 55km SSW of Larsen Bay, Alaska
2012-09-18 01:44:51 UTC
2012-09-18 01:44:51 UTC
reply to post by PuterMan
Nowhere near? Every source shows that the biggest ones were Thera, Changbaishan Volcano and Mt. Tambora. All 3 are VEI 7.
No, not really. The Thera eruption was believed to have been between a VEI 6 and 7 (10 cubic km and 100 cu km) - about 60 cu km of dense rock equivalent.
Whilst large and of course very significant it comes nowhere near being one of the largest volcanic events on earth.
Nowhere near? Every source shows that the biggest ones were Thera, Changbaishan Volcano and Mt. Tambora. All 3 are VEI 7.
new topics
-
Swedish Minister for Gender Equality is Seeking Treatment for Phobia of Bananas
Other Current Events: 3 hours ago -
Satanic ‘Little Season’ of Deception.. Awaken to the Handiwork of the Creator.
ATS Skunk Works: 4 hours ago -
USA-BIDEN and CHINA-Xi Agree Not To Let Artificial Intelligence Decide Nuclear Weapons Use.
World War Three: 4 hours ago -
The mysterious death of Aileen Conway
General Chit Chat: 7 hours ago -
Half-Life 2 is 20 Years Old - its Also Free on Steam until the 18th
Video Games: 11 hours ago
top topics
-
Does the Trump win mean No More Taylor Swift??
Politicians & People: 15 hours ago, 12 flags -
Trump-appointed judge blocks Biden administration overtime rule
Social Issues and Civil Unrest: 17 hours ago, 9 flags -
The mysterious death of Aileen Conway
General Chit Chat: 7 hours ago, 6 flags -
Satanic ‘Little Season’ of Deception.. Awaken to the Handiwork of the Creator.
ATS Skunk Works: 4 hours ago, 3 flags -
USA-BIDEN and CHINA-Xi Agree Not To Let Artificial Intelligence Decide Nuclear Weapons Use.
World War Three: 4 hours ago, 2 flags -
Half-Life 2 is 20 Years Old - its Also Free on Steam until the 18th
Video Games: 11 hours ago, 1 flags -
Swedish Minister for Gender Equality is Seeking Treatment for Phobia of Bananas
Other Current Events: 3 hours ago, 1 flags
active topics
-
The Trump effect 6 days after 2024 election
2024 Elections • 150 • : cherokeetroy -
President-elect TRUMP Picks MATT GAETZ for his ATTORNEY GENERAL - High Level PANIC Ensues.
2024 Elections • 91 • : Xtrozero -
Does the Trump win mean No More Taylor Swift??
Politicians & People • 49 • : JadedGhost -
TODAY IS A HUGE ELECTION DAY FOR AMERICA - November 5th 2024 - Reports from Around The Nation.
2024 Elections • 750 • : WeMustCare -
On Nov. 5th 2024 - AMERICANS Prevented the Complete Destruction of America from Within.
2024 Elections • 156 • : WeMustCare -
President-Elect DONALD TRUMP's 2nd-Term Administration Takes Shape.
Political Ideology • 213 • : WeMustCare -
Satanic ‘Little Season’ of Deception.. Awaken to the Handiwork of the Creator.
ATS Skunk Works • 4 • : NorthOS -
-@TH3WH17ERABB17- -Q- ---TIME TO SHOW THE WORLD--- -Part- --44--
Dissecting Disinformation • 3284 • : 777Vader -
Swedish Minister for Gender Equality is Seeking Treatment for Phobia of Bananas
Other Current Events • 2 • : WeMustCare -
USA-BIDEN and CHINA-Xi Agree Not To Let Artificial Intelligence Decide Nuclear Weapons Use.
World War Three • 5 • : nugget1
