It looks like you're using an Ad Blocker.
Please white-list or disable AboveTopSecret.com in your ad-blocking tool.
Thank you.
Some features of ATS will be disabled while you continue to use an ad-blocker.
share:
I'll bet. My situation is the reverse, and this is the first 'large' (cheers Muzzy) quake experienced at distance.
I do not envy you.
They're terrifying physically, aurally and psychologically!
I do not envy you.
They're terrifying physically, aurally and psychologically!
Posted this over on Quake Watch 2011 but thought some here might be interested.
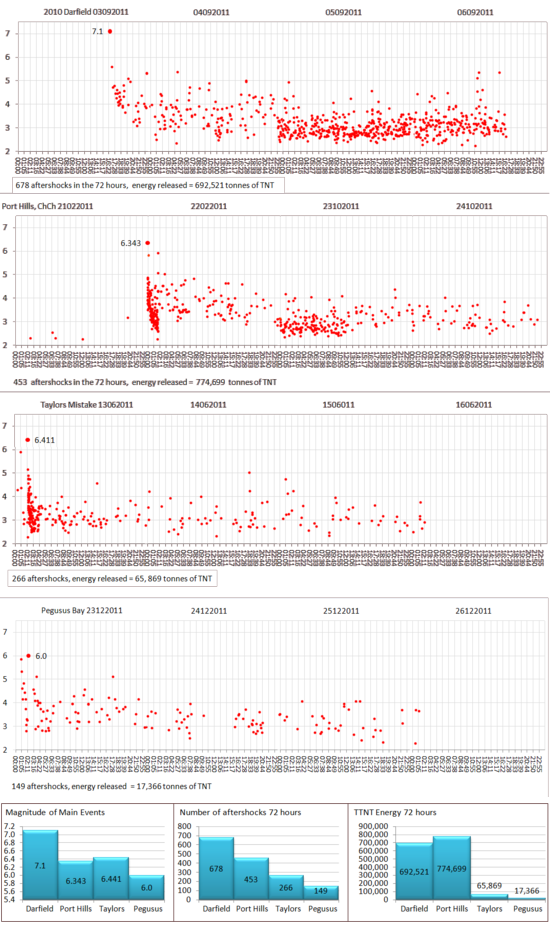
As was recently advised the June 13th quake has been upgraded to 6.441, making it bigger than the February quake which caused all the damage and loss of life.
However that alone does not make it the highest release of energy over the 72 hour timespan I use for aftershock series .
The Feb quake and 72 hrs of aftershocks still released the most energy, even more than the 7.1 and 72 hours of aftershocks
It looks like the two 5.8 and 5.9 aftershocks right after the 6.3 in Feb really made a big difference to the energy totals.
Also the graph shows the 7.1 as a slow lumbering giant of an aftershock series, whereas the Port Hils Feb and Taylors Mistake June aftershocks came in rapidly within hours.
The Pegusus Bay 23rd Dec 6.0 is preliminary at this stage, it could be a month, if not 6-12 months before all the aftershocks are determined, but there is no doubt whatsoever the numbers shown for that can be doubled .
Good for an overview anyway.

full size image here
Data is from Geonet
Co-ordinates of the search area
West 171.81584 South -43.93907
As was recently advised the June 13th quake has been upgraded to 6.441, making it bigger than the February quake which caused all the damage and loss of life.
However that alone does not make it the highest release of energy over the 72 hour timespan I use for aftershock series .
The Feb quake and 72 hrs of aftershocks still released the most energy, even more than the 7.1 and 72 hours of aftershocks
It looks like the two 5.8 and 5.9 aftershocks right after the 6.3 in Feb really made a big difference to the energy totals.
Also the graph shows the 7.1 as a slow lumbering giant of an aftershock series, whereas the Port Hils Feb and Taylors Mistake June aftershocks came in rapidly within hours.
The Pegusus Bay 23rd Dec 6.0 is preliminary at this stage, it could be a month, if not 6-12 months before all the aftershocks are determined, but there is no doubt whatsoever the numbers shown for that can be doubled .
Good for an overview anyway.

full size image here
Data is from Geonet
Co-ordinates of the search area
West 171.81584 South -43.93907
edit on 27-12-2011 by muzzy because: (no reason given)
reply to post by aorAki
Sorry to bump a old thread, was just wondering do you know anything about rainbow looking clouds?
Sorry to bump a old thread, was just wondering do you know anything about rainbow looking clouds?
new topics
-
Bizarre Labour Party Tic Toc Video Becomes Even More Embarrassing
Regional Politics: 1 hours ago -
Potter to WHU
World Sports: 6 hours ago -
Dr. Demento
Music: 8 hours ago -
The elephant in the room (wearing a hoodie)
US Political Madness: 8 hours ago
top topics
-
The elephant in the room (wearing a hoodie)
US Political Madness: 8 hours ago, 14 flags -
To become president, Zelensky had to learn Ukrainian
Political Conspiracies: 15 hours ago, 9 flags -
Dr. Demento
Music: 8 hours ago, 6 flags -
Bizarre Labour Party Tic Toc Video Becomes Even More Embarrassing
Regional Politics: 1 hours ago, 3 flags -
Potter to WHU
World Sports: 6 hours ago, 2 flags
