It looks like you're using an Ad Blocker.
Please white-list or disable AboveTopSecret.com in your ad-blocking tool.
Thank you.
Some features of ATS will be disabled while you continue to use an ad-blocker.
share:
We all know that the polls are rigged, and strongly biased in favour of Hillary Clinton, right?
Even the stones know that the mainstream media are just servants of the Clinton mafia, their lapdogs and lame propaganda tools.
They are disgusting.
But.... really...
who cares?
Since I am 100% convinced that the REAL data are completely different from what the (lame) mainstream media try to sell,
in this thread I will try to work out WHICH are the real data.
And possibly estimate what the results of this election will be.
------------------------------------
Introduction - Note 1
Given the US electoral system, the so called “popular vote” does not count and is totally useless. So we shall dismiss and ignore it.
What is key are the Electoral Map results, state by state.
Introduction - Note 2
In this analysis I will use the input data of “Real Clear Politics” - which, as many of you know - is taken as the official reference by the mainstream media, and by most political analysts.
Real Clear Politics - www.realclearpolitics.com...
As you can see here the projected outcome by Real Clear Politics is a “clear” (pun intended) Clinton victory:
Clinton 297
Trump 241
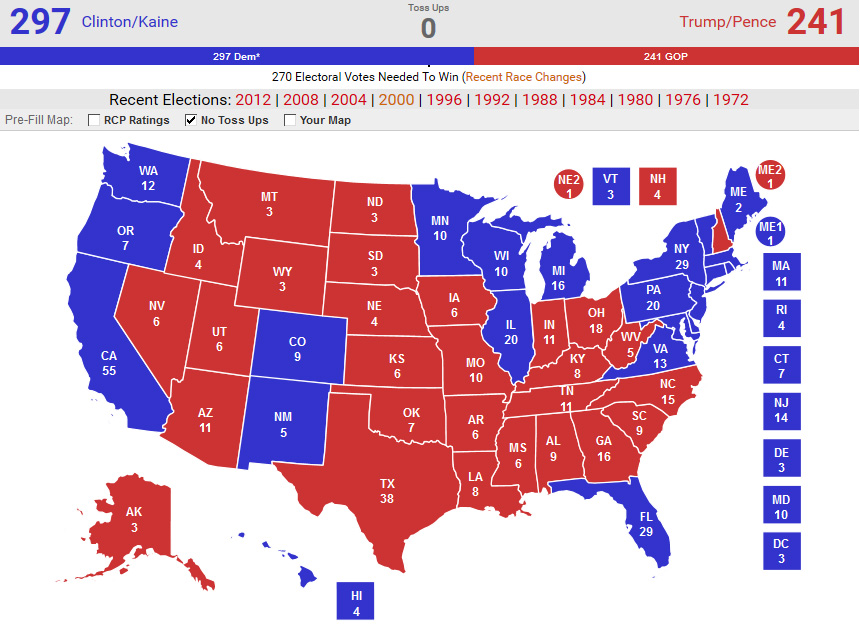
(Note: data collected at 2pm EDT from the above link)
But...
I shall apply 2 correction factors:
1.- the “Shy Trump Supporter” factor
2.- the bias towards Clinton by the servants main stream media - and by the polling agencies.
----------------------------------------------
1.- the “Shy Trump Voter” factor
In the polls conducted by the agencies there are several voters who declare they will vote for Clinton, even knowing they will - in reality - vote for Trump.
This is true especially in the toss-up states, and in the states with strong Clintonite and/or liberal bias (East Coast - New York state and New England, and West Coast (California, Oregon, Washington).
Why this happens?
Some of the Trump voters are afraid to be called/considered racist / sexist / and what have you, and prefer to hide their preference for Trump to pollsters (and to intolerant liberal friends).
To compensate for #1 (the “Shy Trump Voter” factor), I will apply a 2- 2.5% correction in the toss-up states.
( minus 2-2.5% for Clinton, plus 2-2.5% for Trump)
- a slight correction, as can be seen.
To compensate for #2 (the Clinton bias of the polling agencies, and their crooked way of conducting the polls*, I will apply a 2% correction factor to the input data.
( minus 2% for Clinton, plus 2 for Trump)
----------------------------
With these proper correction factors applied, which is the result?
THIS:
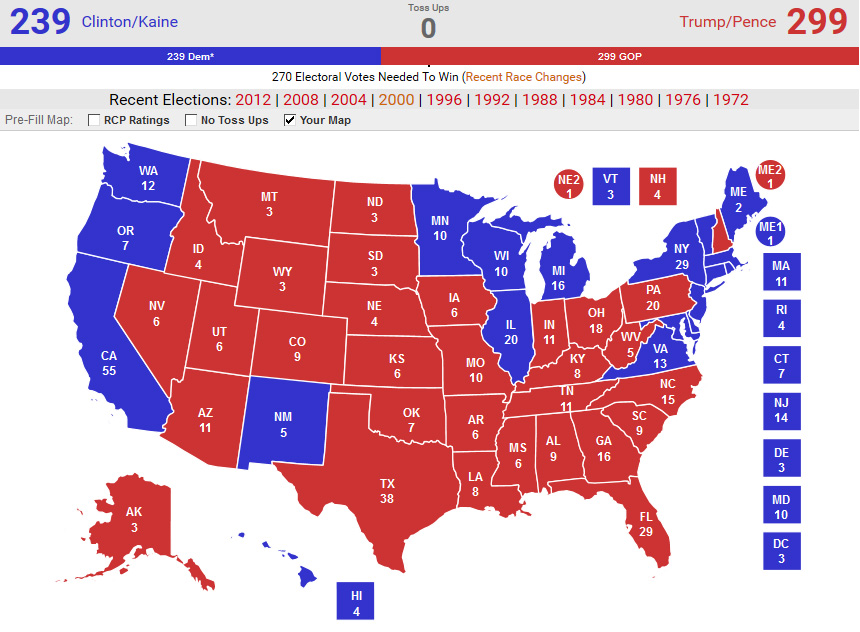
a CLEAR Trump victory
Trump 299
Clinton 239.
And Trump takes the White House.
-----------------------------------------------
As can be seen in the above map, with the “correction factors” applied, Trump takes Florida, Pennsylvania and Colorado (toss-up states which RCP assigns to Clinton).
These were the RealClearPolitics starting data:
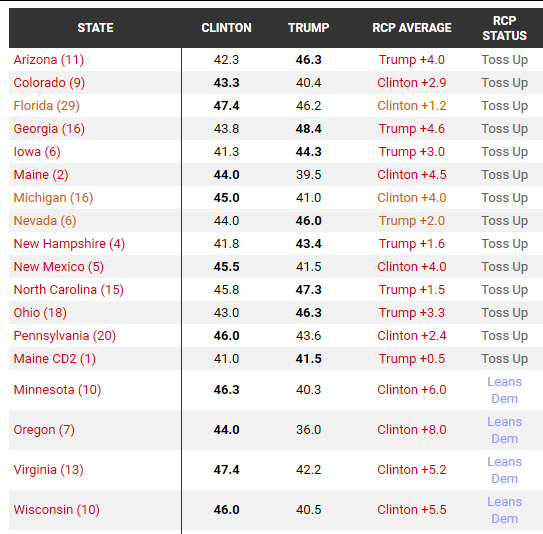
as can be seen, if you apply the above correction factors, a Trump victory 299 to 239 will be the result.
And I consider this result much more realistic,
and more in line with the true sentiment of the country, and with what happens in the real world - and in the Trump rallies (compared by the sad Clinton thingies)
I believe the Clinton camp (Podesta and the other crooks) they know very well that these are the TRUE data, they are scared as hell, and they know they are going to lose.
What do you think?
HF
( >> continues below )
Even the stones know that the mainstream media are just servants of the Clinton mafia, their lapdogs and lame propaganda tools.
They are disgusting.
But.... really...
who cares?
Since I am 100% convinced that the REAL data are completely different from what the (lame) mainstream media try to sell,
in this thread I will try to work out WHICH are the real data.
And possibly estimate what the results of this election will be.
------------------------------------
Introduction - Note 1
Given the US electoral system, the so called “popular vote” does not count and is totally useless. So we shall dismiss and ignore it.
What is key are the Electoral Map results, state by state.
Introduction - Note 2
In this analysis I will use the input data of “Real Clear Politics” - which, as many of you know - is taken as the official reference by the mainstream media, and by most political analysts.
Real Clear Politics - www.realclearpolitics.com...
As you can see here the projected outcome by Real Clear Politics is a “clear” (pun intended) Clinton victory:
Clinton 297
Trump 241

(Note: data collected at 2pm EDT from the above link)
But...
I shall apply 2 correction factors:
1.- the “Shy Trump Supporter” factor
2.- the bias towards Clinton by the servants main stream media - and by the polling agencies.
----------------------------------------------
1.- the “Shy Trump Voter” factor
In the polls conducted by the agencies there are several voters who declare they will vote for Clinton, even knowing they will - in reality - vote for Trump.
This is true especially in the toss-up states, and in the states with strong Clintonite and/or liberal bias (East Coast - New York state and New England, and West Coast (California, Oregon, Washington).
Why this happens?
Some of the Trump voters are afraid to be called/considered racist / sexist / and what have you, and prefer to hide their preference for Trump to pollsters (and to intolerant liberal friends).
To compensate for #1 (the “Shy Trump Voter” factor), I will apply a 2- 2.5% correction in the toss-up states.
( minus 2-2.5% for Clinton, plus 2-2.5% for Trump)
- a slight correction, as can be seen.
To compensate for #2 (the Clinton bias of the polling agencies, and their crooked way of conducting the polls*, I will apply a 2% correction factor to the input data.
( minus 2% for Clinton, plus 2 for Trump)
----------------------------
With these proper correction factors applied, which is the result?
THIS:

a CLEAR Trump victory
Trump 299
Clinton 239.
And Trump takes the White House.
-----------------------------------------------
As can be seen in the above map, with the “correction factors” applied, Trump takes Florida, Pennsylvania and Colorado (toss-up states which RCP assigns to Clinton).
These were the RealClearPolitics starting data:

as can be seen, if you apply the above correction factors, a Trump victory 299 to 239 will be the result.
And I consider this result much more realistic,
and more in line with the true sentiment of the country, and with what happens in the real world - and in the Trump rallies (compared by the sad Clinton thingies)
I believe the Clinton camp (Podesta and the other crooks) they know very well that these are the TRUE data, they are scared as hell, and they know they are going to lose.
What do you think?
HF
( >> continues below )
edit on 6-11-2016 by HeywoodFloyd because: formatting
Note:
If Trump wins also in Michigan - as I consider quite possible - this will be the final result:
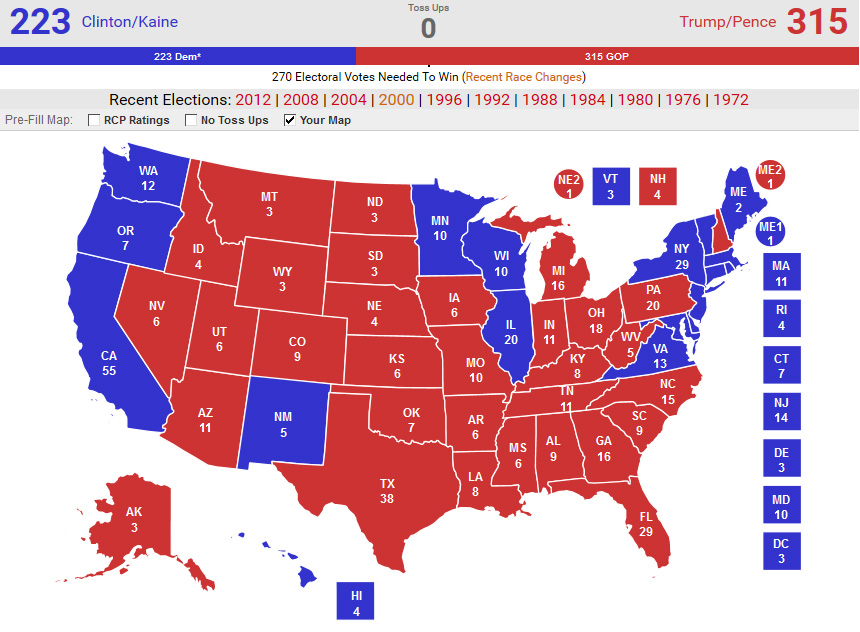
Trump 315
Clinton 223
----------------------------------
I consider possible that Trump wins also Virginia (13) and New Mexico (5)
(see the RCP data above).
In this case the outcome will be:
Trump 333
Clinton 205
---------------------------------
Final note:
please be aware that I applied very slight correction factors to the “official poll data” of RealClearPolitics
---------------------------------
Ok, I look forward to your own (objective) opinion.
HF
If Trump wins also in Michigan - as I consider quite possible - this will be the final result:

Trump 315
Clinton 223
----------------------------------
I consider possible that Trump wins also Virginia (13) and New Mexico (5)
(see the RCP data above).
In this case the outcome will be:
Trump 333
Clinton 205
---------------------------------
Final note:
please be aware that I applied very slight correction factors to the “official poll data” of RealClearPolitics
---------------------------------
Ok, I look forward to your own (objective) opinion.
HF
Ahh yes, the unskewed polls stuff.
That worked out brilliantly as a concept in 2012 which had Romney winning bigly...after it was all unskewed and the super cerial real numbers were there about the shy rmoney supporters who were randomly lying to anonymous pollsters and whatnot.
why is it the same nonsense every 4 years?
Those who dont study history are doomed to repeat it I suppose.
a reply to: HeywoodFloyd
I think it will be a night of popcorn and anxiety for the entire nation. I don't know who will win.
Here. I've made some for you, too!!

I think it will be a night of popcorn and anxiety for the entire nation. I don't know who will win.
Here. I've made some for you, too!!

originally posted by: AboveBoard
a reply to: HeywoodFloyd
I think it will be a night of popcorn and anxiety for the entire nation.
I think I may skip watching it and instead just play some video games. then the 9th will wake up and if nukes are in the air, Hillary won. If mexicans are hung everywhere, Trump won.
either way, its gonna be a 4 year dumpster fire.
a reply to: HeywoodFloyd
I love your analysis. I am from the state of Michigan that is said to go Democrat but I have seen virtually no signs for Hillary around here. I have however seen plenty for Trump. I am not from the inner city, but I would still say that there is a good chance that Michigan might go for Trump.
However, we must factor into this the rigged election possibility, especially, since they have just recently come out and said that Comey has had a change of heart on his email investigation, -AGAIN. I have only seen news of this in print, and have not seen a video of Comey ACTUALLY saying this. That being said, and knowing the main stream media to lie whenever they darn well please. I can’t say with certainty that this story is actually true or not.
No matter what suppression is happening today, this does not mean that Trump voters (or any voter, for that matter) should not go out on the 8th and vote. This is exactly what they want us to do, so stand up and be counted. It is important!
a reply to: HeywoodFloyd
He is not taking PA and probably won't take NC either.
He's lost Utah to that indy. He's lost NV,
But giving him NC and Florida plus all Romney's states he still has no road at all. He needs PA. He needs Florida.
He may get Florida but I'm hopeful. Pennsylvania has been blue for a while now, the cities steer the state and Clinton has the cities.
edit
on 1162016 by Sillyolme because: (no reason given)
a reply to: StarsInDust
Not a big year for yard signs I live in a city and have seen very few. More in the last week. . I was on the road on the east coast last weekend and I saw miles of Clinton/Kaine signs and that was in rural areas which was a nice surprise.
There were Trump signs too but maybe one in ten .
Not a big year for yard signs I live in a city and have seen very few. More in the last week. . I was on the road on the east coast last weekend and I saw miles of Clinton/Kaine signs and that was in rural areas which was a nice surprise.
There were Trump signs too but maybe one in ten .
I hope your right! We are seriously in trouble if Hillary gets in. We may be in trouble if Trump gets in but many things like the SCOTUS, Immigration,
and so much more are a little more to my liking!
a reply to: StarsInDust
I gave you a star for encouraging folks to vote.
Left or right it's the patriotic thing to do. 🗽
I gave you a star for encouraging folks to vote.
Left or right it's the patriotic thing to do. 🗽
originally posted by: Sillyolme
Did your analysis include Comeys announcement?
Shy Trump and Media Bias precede the last few weeks.
I don't think it'll be 2.0-2.5%
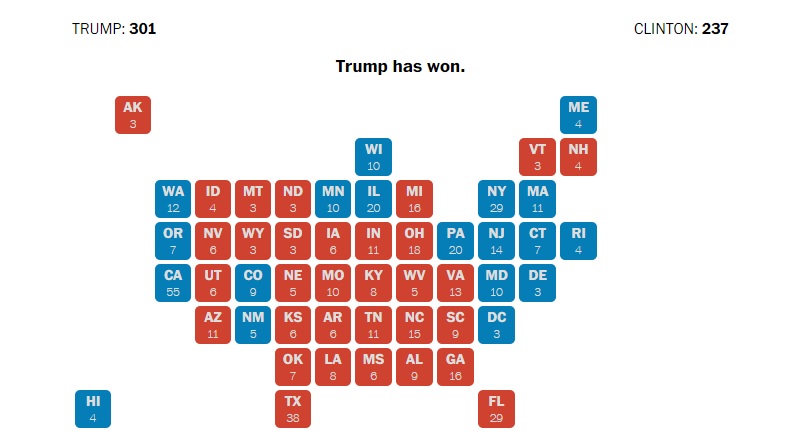
I'm willing to say that what we see as statistical dead heats or +1% to Hillary will actually go to Trump
Apply that equation and we get this, based on RCP averages as of today:
originally posted by: Sillyolme
Did your analysis include Comeys announcement?
The Comey announcement might have the opposite effect. I was seriously debating Stein or Johnson, with a strong possibility of writing in, but this announcement has changed my mind. The announcement is BS. There is evidence of crime, as there was the first time, and she skates... again.
They keep skating on everything and it's BS. No more. No more of this. Illegal wars and disregard for law. Enough is enough.
originally posted by: Ksihkehe
The Comey announcement might have the opposite effect. I was seriously debating Stein or Johnson, with a strong possibility of writing in, but this announcement has changed my mind. The announcement is BS. There is evidence of crime, as there was the first time, and she skates... again.
Comey's announcement just demonstrates 3 things:
1.- how corrupt and coward Comey is. (and most of the FBI).
2.- how corrupt is Loretta Lynch and the "Department of Justice" of the USA
and we can imagine how fierce has been the pressure of Lynch and the DOJ on Comey and the FBI.
3.- that "Justice" in the USA does not exist anymore (if it ever did....)
4.- how strong are the Clinton crooked mafia and their Saudi Arabia friends.
well... it is 4. Never mind.
-------------------------------
PS: I think this will not affect the elections.
Trump voters will be even more angry and more determined.
originally posted by: AboveBoard
a reply to: HeywoodFloyd
I think it will be a night of popcorn and anxiety for the entire nation. I don't know who will win.
Here. I've made some for you, too!!
Thanks !!
I wasn't going to vote for either candidate, but after today's announcement, I'm voting Trump.
I don't like him, but to hell with it. Hillary is Evil Incarnate.
I'm sure there might be a few more like me. Hopefully statistically significant.
I don't like him, but to hell with it. Hillary is Evil Incarnate.
I'm sure there might be a few more like me. Hopefully statistically significant.
edit on 6-11-2016 by TomLawless because: (no reason
given)
originally posted by: dukeofjive696969
Good luck with that.
RI is the only New England state Trump won't win.
originally posted by: tkwasny
originally posted by: dukeofjive696969
Good luck with that.
RI is the only New England state Trump won't win.
I did a few in the past few weeks the best i had trump was 256.
Like i said good luck on the 8th
new topics
-
Steering the Titantic from the Drydock.
US Political Madness: 2 hours ago
top topics
-
House Passes Laken Riley Act
Mainstream News: 14 hours ago, 23 flags -
What Comes After January 20th
Mainstream News: 17 hours ago, 18 flags -
Los Angeles brush fires latest: 2 blazes threaten structures, prompt evacuations
Mainstream News: 13 hours ago, 7 flags -
Hearing more ambulances lately
Medical Issues & Conspiracies: 13 hours ago, 7 flags -
Paramilitary Leaks - John Williams
Whistle Blowers and Leaked Documents: 12 hours ago, 6 flags -
Those stupid GRAVITE commercials
Rant: 17 hours ago, 5 flags -
Steering the Titantic from the Drydock.
US Political Madness: 2 hours ago, 5 flags -
The more I think about it
General Chit Chat: 15 hours ago, 4 flags -
Canada as a state .. how would it work?
General Chit Chat: 17 hours ago, 4 flags -
Some sausage, some chicken, some sauce, some onions and some garlic...and some peppers!
Food and Cooking: 13 hours ago, 3 flags
active topics
-
Steering the Titantic from the Drydock.
US Political Madness • 4 • : andy06shake -
ILLUMINATION: Dimensions / Degrees – Da Vincis Last Supper And The Philosophers Stone
Secret Societies • 21 • : CarlLaFong -
Canada as a state .. how would it work?
General Chit Chat • 18 • : YouSir -
Let's Buy Greenland
General Chit Chat • 18 • : CriticalStinker -
Meta Llama local AI system is scary good
Science & Technology • 50 • : ArMaP -
Gravitic Propulsion--What IF the US and China Really Have it?
General Conspiracies • 35 • : bastion -
-@TH3WH17ERABB17- -Q- ---TIME TO SHOW THE WORLD--- -Part- --44--
Dissecting Disinformation • 3968 • : AianawaQ1320 -
Post A Funny (T&C Friendly) Pic Part IV: The LOL awakens!
General Chit Chat • 8000 • : KrustyKrab -
Los Angeles brush fires latest: 2 blazes threaten structures, prompt evacuations
Mainstream News • 13 • : BeyondKnowledge3 -
House Passes Laken Riley Act
Mainstream News • 16 • : KrustyKrab
