It looks like you're using an Ad Blocker.
Please white-list or disable AboveTopSecret.com in your ad-blocking tool.
Thank you.
Some features of ATS will be disabled while you continue to use an ad-blocker.
share:
3/4 hr ago
Public ID 2015p076040
Intensity moderate
Universal Time January 29 2015, 3:14:15
NZ Daylight Time Thu, Jan 29 2015, 4:14:15 pm
Depth 7 km
Magnitude 4.0
Location 20 km north-east of Ohakune (MT RUAPEHU VOLCANO)
Latitude, Longitude -39.27, 175.57
Agency WEL(GNS_Primary)
Type earthquake
Status reviewed
Quality best
www.geonet.org.nz...
and a 3.4 aftershock
www.geonet.org.nz...
is it about to erupt again???????
Drums
edit on 01000000272715 by muzzy because: (no reason given)
ach they are no good, hours behind
here IRIS BKZ ds.iris.edu...
which is about 80km west of the mt.
edit on 01u272715 by muzzy because: (no reason given)
and IRIS HIZ ds.iris.edu...
which is 100km to the north west
edit on 01u272715 by muzzy because: (no reason given)
a reply to: muzzy
May not be directly related to the two quakes, but still changes are happening.
info.geonet.org.nz...
*transferred this over to Volcano Watch 2015
May not be directly related to the two quakes, but still changes are happening.
Mt Ruapehu’s Crater Lake has been heating again. Since early December 2014 the temperature has risen from 15 °C and has now reached temperatures over 40 °C. Similar temperatures were reached in March 2011 and April 2014, before the lake cooled.
Data from a recent Crater Lake sampling (14 January) has shown there are several changes in the lake chemistry. In particular we see evidence for increased amounts of volcanic gas discharging through the lake. The increase in the lake temperature and gas discharge is probably indicative of renewed heating of the hydrothermal system under the lake. Observations from recent visits and pilot reports confirm some convection is present in the lake. The lake has changed from a blue/green colour to light grey as a consequence.
info.geonet.org.nz...
*transferred this over to Volcano Watch 2015
edit on 01u292915 by muzzy because: (no reason given)
F-E Region: Southeast of Loyalty Islands
Time: 2015-01-30 17:57:59.7 UTC
Magnitude: 6.0 (Mw)
Epicenter: 170.18°E 21.40°S
Depth: 10 km
geofon.gfz-potsdam.de...
map location
Time: 2015-01-30 17:57:59.7 UTC
Magnitude: 6.0 (Mw)
Epicenter: 170.18°E 21.40°S
Depth: 10 km
geofon.gfz-potsdam.de...
map location
edit on 01000000292915 by muzzy because: add map link
4.7
205km ESE of City of Saint Paul, Alaska
2015-01-31 06:39:22 UTC-11:00 17.1 km
5.3
92km SE of City of Saint Paul, Alaska
2015-01-31 06:39:12 UTC-11:00 10.0 km
4.6
92km SE of City of Saint Paul, Alaska
2015-01-31 06:21:31 UTC-11:00 11.3 km
4.2
204km ESE of City of Saint Paul, Alaska
2015-01-31 06:16:25 UTC-11:00 16.3 km
4.8
92km SE of City of Saint Paul, Alaska
2015-01-31 06:16:17 UTC-11:00 19.5 km
5.3 92km SE of City of Saint Paul, Alaska
2015-01-31 01:38:31 UTC-11:00 10.0 km
4.8
94km SE of City of Saint Paul, Alaska
2015-01-30 16:24:56 UTC-11:00 5.6 km
4.5
99km SE of City of Saint Paul, Alaska
2015-01-30 14:39:29 UTC-11:00 19.5 km
A lot of activity in the Bering sea.
%2C%22viewMode s%22%3A[%22map%22%3Atrue%2C%22list%22%3Afalse%2C%22settings%22%3Atrue%2C%22help%22%3Afalse]]]USGS map of the world
edit on 31-1-2015 by
Darkblade71 because: (no reason given)
edit on 31-1-2015 by Darkblade71 because: (no reason given)
a reply to: Darkblade71
That will stir up the crabs!
My guess is that its the off season right now for crab fishing, being Winter up there.
That will stir up the crabs!
My guess is that its the off season right now for crab fishing, being Winter up there.
Seems another quake swarm is starting in Tjörnes Fracture Zone, Iceland. First swarm of the year there. There is actually 2 swarms, one near Grimsey,
and another near Kópasker. So far there has been 50 quakes within 24 hours, strongest magnitude 3.1, lot variation in depth. TFZ still could have
enough tension for magnitude 6.0+ quake. In 1976 magnitude 6.3 quake hit the Kópasker.


edit on 2-2-2015 by Thebel because: (no reason given)
Big One
M 6.3 - 87km NW of La Punta, Argentina
DYFI? - IVShakeMap - VPAGER - GREEN
Time
2015-02-02 10:49:48 UTC
Location
32.715°S 67.062°W
Depth
172.3 km
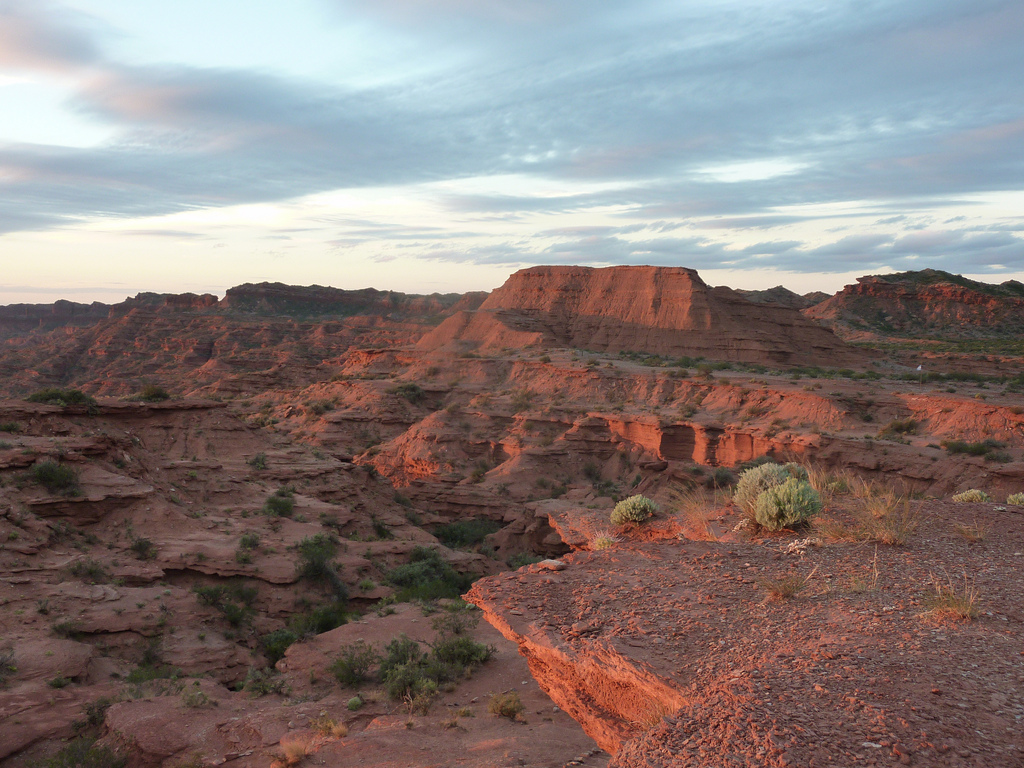
This is located in the southern end of Sierra de las Quijadas National Park.

moon.com...
whc.unesco.org...
M 6.3 - 87km NW of La Punta, Argentina
DYFI? - IVShakeMap - VPAGER - GREEN
Time
2015-02-02 10:49:48 UTC
Location
32.715°S 67.062°W
Depth
172.3 km
This is located in the southern end of Sierra de las Quijadas National Park.

moon.com...
whc.unesco.org...
M6.0 - South of Panama
Event Time
2015-02-05 04:40:54 (UTC)
Nearby Cities
314km (195mi) S of Punta de Burica, Panama
341km (212mi) S of Puerto Armuelles, Panama
351km (218mi) S of Pedregal, Panama
358km (222mi) S of David, Panama
545km (339mi) SSE of San Jose, Costa Rica
earthquake.usgs.gov...
M5.6 - 4km ESE of Coloncito, Venezuela
Event Time
2015-02-05 04:21:49 (UTC)
Nearby Cities
4km (2mi) ESE of Coloncito, Venezuela
23km (14mi) ENE of La Fria, Venezuela
39km (24mi) NE of San Juan de Colon, Venezuela
39km (24mi) E of Puerto Santander, Colombia
467km (290mi) NNE of Bogota, Colombia
earthquake.usgs.gov...
Event Time
2015-02-05 04:40:54 (UTC)
Nearby Cities
314km (195mi) S of Punta de Burica, Panama
341km (212mi) S of Puerto Armuelles, Panama
351km (218mi) S of Pedregal, Panama
358km (222mi) S of David, Panama
545km (339mi) SSE of San Jose, Costa Rica
earthquake.usgs.gov...
M5.6 - 4km ESE of Coloncito, Venezuela
Event Time
2015-02-05 04:21:49 (UTC)
Nearby Cities
4km (2mi) ESE of Coloncito, Venezuela
23km (14mi) ENE of La Fria, Venezuela
39km (24mi) NE of San Juan de Colon, Venezuela
39km (24mi) E of Puerto Santander, Colombia
467km (290mi) NNE of Bogota, Colombia
earthquake.usgs.gov...
edit on 4-2-2015 by Darkblade71 because: (no reason given)
That must be what was bothering hubby & I tonight!
I finally pulled up USGS & saw the 5.6 in Venezuela in red!
(Since downgraded to a 5.3.)
Thought that's not that big.
Then saw the 6.0 in Panama, not in red!
What's up with that Useless???
Then I remembered a friend of ours just went to Panama for 10 days or 2 weeks!
5.1 in Venezuela this morning, then a 5.3 tonight & now a 6.0.
Getting bigger & moving west.
Sure hope that's the end of it!
WOQ
Hey good news in Oklahoma. I missed this, but back in December, the OK Corporation Commission instituted new regulations on injection wells.
source
They shut down the injection well nearest the Cherokee, OK quakes yesterday.
Considering another Mag 4.3 just shook the area, it seems their shutdown order comes in the nick of time. It will be interesting to see how long it takes the quakes in the area to subside.
But, If the quakes continue in the epicentral region of the closed well, we may have to rethink this causal relationship.
I really hope this helps--the local residents need a break.
Due to a huge increase in earthquakes in recent years, the Corporation Commission began using a “traffic light” system in December 2013.
Under the system, wells within a six-mile radius of a magnitude-4.0 earthquake are placed under operating restrictions. If additional earthquakes occur within six miles of an active well in that area, the commission can order the operator to halt injection while more information is gathered.
source
They shut down the injection well nearest the Cherokee, OK quakes yesterday.
Considering another Mag 4.3 just shook the area, it seems their shutdown order comes in the nick of time. It will be interesting to see how long it takes the quakes in the area to subside.
But, If the quakes continue in the epicentral region of the closed well, we may have to rethink this causal relationship.
I really hope this helps--the local residents need a break.
edit on 2/5/2015 by Olivine because: funky formatting
Not a lot been happening in NZ since that 5.951 on 05/01/15
This was interesting yesterday, near Gisborne
ID: 2015p097189 Network: geonet
Status: confirmed
Date/Time NZDT: 06/02/2015 12:02:35
Date/Time UTC: 05/02/2015 23:02:35
Latitude, Longitude: -38.6087, 177.9136
Magnitude: 4.47M
Depth: 19.88 km
Energy Released: 75.5890 tonnes of TNT
Location: Waipaoa River near Bushmere Rd, Pututahi, NW of Gisborne
www.geonet.org.nz...
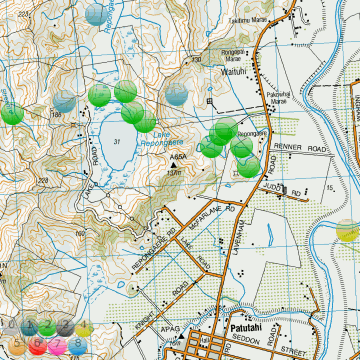
it was after a swarm of 9 quakes, M1.89 to M2.98 at Lake Repongaere, then there were 4 aftershocks M1.85 to M3.83

interactive map
note new icons
I was doing some animations using the pins I created at Christmas, and realized that the pin marker wasn't actually pointing to the epicentre correctly, the actual epicentre was in at the base of the round pin head, not at the bottom of the pin shaft where it goes into the map surface, really screwed up some of my mapping. Also with the "old" orbs with the shadow at the base, gave the wrong impression too, the epicentre is actually the centre of the orb, not the base (shadow) where its sitting on the map. I think these new ones show a truer location, the epicentre is at the centre of the circle.
By using Dropbox I have substituted the new circles for the old orbs, so all my old interactive maps will now show the new icons right across the board.
This was interesting yesterday, near Gisborne
ID: 2015p097189 Network: geonet
Status: confirmed
Date/Time NZDT: 06/02/2015 12:02:35
Date/Time UTC: 05/02/2015 23:02:35
Latitude, Longitude: -38.6087, 177.9136
Magnitude: 4.47M
Depth: 19.88 km
Energy Released: 75.5890 tonnes of TNT
Location: Waipaoa River near Bushmere Rd, Pututahi, NW of Gisborne
www.geonet.org.nz...
it was after a swarm of 9 quakes, M1.89 to M2.98 at Lake Repongaere, then there were 4 aftershocks M1.85 to M3.83

interactive map
note new icons
I was doing some animations using the pins I created at Christmas, and realized that the pin marker wasn't actually pointing to the epicentre correctly, the actual epicentre was in at the base of the round pin head, not at the bottom of the pin shaft where it goes into the map surface, really screwed up some of my mapping. Also with the "old" orbs with the shadow at the base, gave the wrong impression too, the epicentre is actually the centre of the orb, not the base (shadow) where its sitting on the map. I think these new ones show a truer location, the epicentre is at the centre of the circle.
By using Dropbox I have substituted the new circles for the old orbs, so all my old interactive maps will now show the new icons right across the board.
edit on 02u363615 by muzzy because: (no reason given)
30 days since the M5.951 at Gibson Stream west of the Wilberforce River, Canterbury, NZ.
Quite a big quake, but not that many aftershocks in 30 days
Most of them occurred in the first 24 hours.
Reviewed Data.
M5=1
M4=4
M3=30
M2=229
M1=9
Total=272
I made a couple of animations ( using the new circle markers)

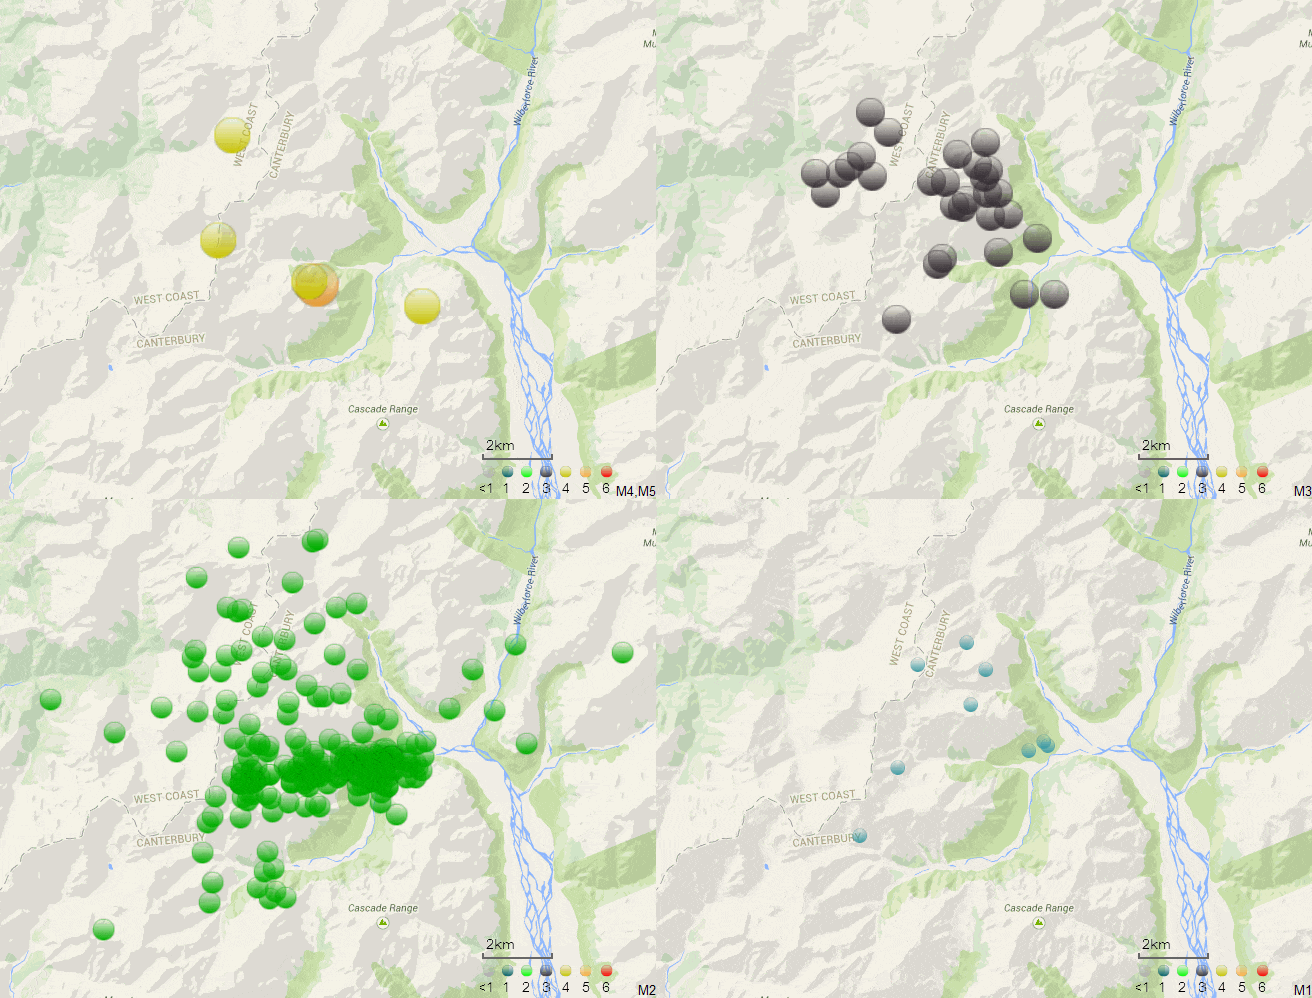
What is interesting is the M2's are mainly along Gibson Creek where the main shock was at, whereas the M3's tend to be north, under Mt Eliot, Eliot Ridge and NW to Mt Bannatyne
This is totally opposite to the preliminary data of 5th Jan which showed the M3's to the south of Gibson and Unknown Stream in the Cascade Range.
Looks like Geonet struggled with this one right from the start, if you recall they initially had the 5.951 at Lake Coleridge.

interactive map for 5th Jan for comparison
Just goes to show, even tracking the aftershocks in the first few hours/days doesn't necessarily give any clue as to where the movement is going, especially when the initial (preliminary) data is wrong.
based on the M2 map there is a Fault along Gibson Creek West to East, but based on the M3's its trending NW to SE in the mountains parallel (west) to Griffiths Stream
Based on the preliminary data it was going South
Animations here are not full size
rightclick"viewimage" for full size, if you want to
Quite a big quake, but not that many aftershocks in 30 days
Most of them occurred in the first 24 hours.
Reviewed Data.
M5=1
M4=4
M3=30
M2=229
M1=9
Total=272
I made a couple of animations ( using the new circle markers)

What is interesting is the M2's are mainly along Gibson Creek where the main shock was at, whereas the M3's tend to be north, under Mt Eliot, Eliot Ridge and NW to Mt Bannatyne
This is totally opposite to the preliminary data of 5th Jan which showed the M3's to the south of Gibson and Unknown Stream in the Cascade Range.
Looks like Geonet struggled with this one right from the start, if you recall they initially had the 5.951 at Lake Coleridge.

interactive map for 5th Jan for comparison
Just goes to show, even tracking the aftershocks in the first few hours/days doesn't necessarily give any clue as to where the movement is going, especially when the initial (preliminary) data is wrong.
based on the M2 map there is a Fault along Gibson Creek West to East, but based on the M3's its trending NW to SE in the mountains parallel (west) to Griffiths Stream
Based on the preliminary data it was going South
edit on 02u363615 by muzzy because: (no reason given)
Animations here are not full size
rightclick"viewimage" for full size, if you want to
edit on 02000000363615 by muzzy because: (no reason given)
a reply to: muzzy
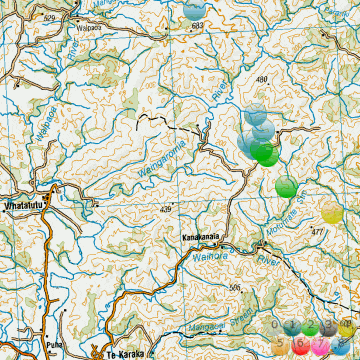
Another M4 in the Gisborne area, with 9 aftershocks
ID: 2015p098114 Network: geonet
Status: confirmed
Date/Time NZDT: 06/02/2015 20:15:29
Date/Time UTC: 06/02/2015 07:15:29
Latitude, Longitude: -38.3907, 178.0278
Magnitude: 4.03M
Depth: 31.13 km
Energy Released: 16.7324 tonnes of TNT
Location: Matawai
www.geonet.org.nz...

interactive map
Another M4 in the Gisborne area, with 9 aftershocks
ID: 2015p098114 Network: geonet
Status: confirmed
Date/Time NZDT: 06/02/2015 20:15:29
Date/Time UTC: 06/02/2015 07:15:29
Latitude, Longitude: -38.3907, 178.0278
Magnitude: 4.03M
Depth: 31.13 km
Energy Released: 16.7324 tonnes of TNT
Location: Matawai
www.geonet.org.nz...

interactive map
Another aspect of earthquakes maybe?
Earthquake Prediction – A Suppressed Science – The Music of the Spheres
Earthquake Prediction – A Suppressed Science – The Music of the Spheres
Damn. I should have written down my prediction. Even if it was the most meager of earthquakes. I noticed that one of the ongoing earthquakes in
Northern Nevada- near Oregon, popped up to above 3M. Tiny I agree. But I immediately wonder if Idaho would respond. I believe the swarms are
connected. Sure enough, Idaho just chimed in.
Given that Nevada and Idaho have rich volcanic histories, I'll let you all do the speculating about the sources since I think some of you know where I would put my bet.
Funny, the two quakes are about the same magnitude. 3.1, 3.2. And, yes I know there are lots of little one under 3.
Given that Nevada and Idaho have rich volcanic histories, I'll let you all do the speculating about the sources since I think some of you know where I would put my bet.
Funny, the two quakes are about the same magnitude. 3.1, 3.2. And, yes I know there are lots of little one under 3.
edit on 8-2-2015 by
ericblair4891 because: (no reason given)
new topics
-
Political Warfare & The Resister Special Forces Underground
Political Ideology: 1 hours ago -
Trump Cancel trip to New Jersey because of drones
Aliens and UFOs: 1 hours ago -
School shooting in Madison Wi.
Social Issues and Civil Unrest: 6 hours ago -
Prisoner CNN helped free from Syrian prison was actually notorious Assad regime torturer: report
Mainstream News: 8 hours ago -
Labour Plotting to Postpone May's Council Elections ?
Regional Politics: 9 hours ago -
Is this really what is going on?
General Conspiracies: 10 hours ago -
Russias War Against Religion in Ukraine
World War Three: 10 hours ago
top topics
-
iPhone Microphone Being Accessed by Unknown App
The Gray Area: 13 hours ago, 10 flags -
Is this really what is going on?
General Conspiracies: 10 hours ago, 10 flags -
School shooting in Madison Wi.
Social Issues and Civil Unrest: 6 hours ago, 9 flags -
Prisoner CNN helped free from Syrian prison was actually notorious Assad regime torturer: report
Mainstream News: 8 hours ago, 8 flags -
Russias War Against Religion in Ukraine
World War Three: 10 hours ago, 4 flags -
Labour Plotting to Postpone May's Council Elections ?
Regional Politics: 9 hours ago, 4 flags -
Trump Cancel trip to New Jersey because of drones
Aliens and UFOs: 1 hours ago, 3 flags -
Political Warfare & The Resister Special Forces Underground
Political Ideology: 1 hours ago, 2 flags
active topics
-
Trump Cancel trip to New Jersey because of drones
Aliens and UFOs • 13 • : SteamyAmerican -
The Acronym Game .. Pt.4
General Chit Chat • 1020 • : Encia22 -
-@TH3WH17ERABB17- -Q- ---TIME TO SHOW THE WORLD--- -Part- --44--
Dissecting Disinformation • 3723 • : Guyfriday -
School shooting in Madison Wi.
Social Issues and Civil Unrest • 37 • : BernnieJGato -
Drones everywhere in New Jersey ---and Elsewhere Master Thread
Aliens and UFOs • 195 • : Guyfriday -
Political Warfare & The Resister Special Forces Underground
Political Ideology • 0 • : ADVISOR -
Statements of Intent from Incoming Trump Administration Members - 2025 to 2029.
2024 Elections • 46 • : WeMustCare -
Defending the need for adherence to Old Testament commandments under the new covenant of Christ
Conspiracies in Religions • 34 • : FullHeathen -
iPhone Microphone Being Accessed by Unknown App
The Gray Area • 3 • : whyamIhere -
Labour Plotting to Postpone May's Council Elections ?
Regional Politics • 4 • : NorthOS

