It looks like you're using an Ad Blocker.
Please white-list or disable AboveTopSecret.com in your ad-blocking tool.
Thank you.
Some features of ATS will be disabled while you continue to use an ad-blocker.

Dangerous Gas Theory in relation to earthquakes and increased seismic activity
page: 14
share:
Many earthquake experts will argue that global seismic activity has been normal, but I argue on the contrary. In the month of December, 2012, I argued
that earthquakes were on the rise. Charts and graphs were shown to me in an attempt to prove me wrong, “nothing to see here, move along please.”
But then in the last couple of weeks of January some quake swarms finally started getting some people’s attention, especially one that was raging
away in the Solomon Islands area of the South Pacific. Finally, earlier this month, an 8.0 struck and caused a small 3 foot tsunami that claimed a
handful of lives and destroyed homes and businesses along the coasts of the islands.
It wasn’t the 8.0 that surprised anyone. They are fairly common in this part of the world. It was the large quakes that preceded and followed the 8.0. Dozens of quakes above 5.0, and in that 7 day period preceding the big quake, the largest one of 2013 to that date, the USGS reported that there were like 150 quakes at 5.0 or above globally.
On the Quake Watch 2013 one of the experts stated prior to this active week to call him when there were 60 or more 5.0’s in a single week, then he would worry about increased seismic activity. Well, I believe that 150 in a single week is a pretty big increase, wouldn’t you say?
Is he worried about it yet? I don’t know, but I’ve been watching intently over the past two months all the small quakes, especially the ones in unusual places where they shouldn’t be occurring. And I believe they have everything to do with the rapid heating of the atmosphere that I have presented in my dangerous gas theory. To find out more about the theory, check out the thread here…
www.abovetopsecret.com...
Now the big question remains; how are the earthquakes related to dangerous gases. This is a theory proposed a few years back in a book by James McGuire entitled Waking the Giant: How a changing climate triggers earthquakes, tsunamis and volcanoes, where the author states that the melting ice at the poles relieves pressure on the earth’s continental plates. The slightest pressure change will cause tectonic movement resulting in earthquakes. Basically, as the atmosphere heats up, we are experiencing a rapid thawing of Arctic ice. As the ice retreats, all that weight relieves pressure on the Earth’s crust which would naturally cause it to adjust.
According to an article on NPR.org the summer of 2012 saw the most dramatic ice melt in several thousand years. It literally smashed records. Of course there is always melt in the summer time, about half the ice, but the article points out three quarters of the ice melted this past summer. The previous record for ice melt was in 2007, also within the time frame of the rapid methane increase in the atmosphere. The additional ice melt this year was the size of Texas. That’s a lot of ice and a lot of weight on the continental plates.
"Astonishing" Arctic ice melt
As the ice retreats relieving pressure on those plates, it causes the water levels to rise, which is another point of pressure on the Earth’s crust. Keep in mind that the plates underneath the oceans are more fragile than land-based plates. Taking that into consideration, you can see that it’s not going to take much extra mass to cause seismic instability. Every square mile of water that is one meter deep is nearly 6 billion pounds. Sure, the waters haven’t risen that much, but consider any additional height is going to add billions of pounds of extra mass into the oceans and the level of the water rising isn’t going to be the same throughout the globe. Some areas are going to experience more sea level rise than others. That’s more pressure on certain areas which would heighten the seismic activity.
Here is a brief description of how Johnny Mnemonic, author of the Jumping Jack Flash Hypothesis and contributor to the dangerous gas theory, describes this extra mass on his website.
Jumping Jack Flash Hypothesis
Are the sea levels really rising? Yes, according to the climate experts, predicting that by the end of this century the sea level will rise 80 centimeters, or 2.6 feet. This is nearly that one meter we were talking about a minute ago that’s going to add nearly 6 billion pounds of weight to the Earth’s crust per every square mile. How can this kind of weight not have an effect on the plates underneath the oceans?
Some of these climatologists actually believe that it could rise to two meters instead of one. Beyond the unimaginable devastation that a two meter rise would do to the coastal cities around the planet, earthquakes, volcanoes and tsunamis would make these places uninhabitable. We would be faced with an entirely different world than the one we know. Consider that half of the world’s population lives within 62 miles of a coast.
I believe that these experts are being generous by giving us till the end of the century. As I’ve discussed in the dangerous gas thread this threat is here and now. The increases in all these phenomenon are now and I don’t think the public is being given accurate numbers. Earthquakes have risen each year since 2007 at an alarming rate.
continued...
It wasn’t the 8.0 that surprised anyone. They are fairly common in this part of the world. It was the large quakes that preceded and followed the 8.0. Dozens of quakes above 5.0, and in that 7 day period preceding the big quake, the largest one of 2013 to that date, the USGS reported that there were like 150 quakes at 5.0 or above globally.
On the Quake Watch 2013 one of the experts stated prior to this active week to call him when there were 60 or more 5.0’s in a single week, then he would worry about increased seismic activity. Well, I believe that 150 in a single week is a pretty big increase, wouldn’t you say?
Is he worried about it yet? I don’t know, but I’ve been watching intently over the past two months all the small quakes, especially the ones in unusual places where they shouldn’t be occurring. And I believe they have everything to do with the rapid heating of the atmosphere that I have presented in my dangerous gas theory. To find out more about the theory, check out the thread here…
www.abovetopsecret.com...
Now the big question remains; how are the earthquakes related to dangerous gases. This is a theory proposed a few years back in a book by James McGuire entitled Waking the Giant: How a changing climate triggers earthquakes, tsunamis and volcanoes, where the author states that the melting ice at the poles relieves pressure on the earth’s continental plates. The slightest pressure change will cause tectonic movement resulting in earthquakes. Basically, as the atmosphere heats up, we are experiencing a rapid thawing of Arctic ice. As the ice retreats, all that weight relieves pressure on the Earth’s crust which would naturally cause it to adjust.
According to an article on NPR.org the summer of 2012 saw the most dramatic ice melt in several thousand years. It literally smashed records. Of course there is always melt in the summer time, about half the ice, but the article points out three quarters of the ice melted this past summer. The previous record for ice melt was in 2007, also within the time frame of the rapid methane increase in the atmosphere. The additional ice melt this year was the size of Texas. That’s a lot of ice and a lot of weight on the continental plates.
"Astonishing" Arctic ice melt
This melting trend is accelerating because the ice in the Arctic is getting thinner as the region warms. A few decades ago, lots of ice in the Arctic was 10 feet thick and would clump up as wind pushed it around the northern coastlines. "That ice used to survive and stir around in the Arctic for decades and create a very thick mass that could survive a few warm summers," Scambos says. "We don't get that anymore. We get persistently warm summers that have gradually eroded the ice cover until it's very, very thin and not stable." Scambos isn't the only one startled by this abrupt decline. "It doesn't take a scientist to look at what's happened to the Arctic sea ice to know that something really huge is happening in the climate system," says Jennifer Francis at Rutgers University.
As the ice retreats relieving pressure on those plates, it causes the water levels to rise, which is another point of pressure on the Earth’s crust. Keep in mind that the plates underneath the oceans are more fragile than land-based plates. Taking that into consideration, you can see that it’s not going to take much extra mass to cause seismic instability. Every square mile of water that is one meter deep is nearly 6 billion pounds. Sure, the waters haven’t risen that much, but consider any additional height is going to add billions of pounds of extra mass into the oceans and the level of the water rising isn’t going to be the same throughout the globe. Some areas are going to experience more sea level rise than others. That’s more pressure on certain areas which would heighten the seismic activity.
Here is a brief description of how Johnny Mnemonic, author of the Jumping Jack Flash Hypothesis and contributor to the dangerous gas theory, describes this extra mass on his website.
Jumping Jack Flash Hypothesis
Think about your average volcano sticking out of the ocean. It may have 100 square miles (10x10 miles) where added mass could have some effect. So if the sea level around that volcano is increased by one meter then the amount of newly-introduced weight affecting that volcano is 570 billion pounds. If it was 99% of the way to blowing its top already then that might just be plenty to push it over the edge. The same is true of faults, except their area is often much larger.
Are the sea levels really rising? Yes, according to the climate experts, predicting that by the end of this century the sea level will rise 80 centimeters, or 2.6 feet. This is nearly that one meter we were talking about a minute ago that’s going to add nearly 6 billion pounds of weight to the Earth’s crust per every square mile. How can this kind of weight not have an effect on the plates underneath the oceans?
Some of these climatologists actually believe that it could rise to two meters instead of one. Beyond the unimaginable devastation that a two meter rise would do to the coastal cities around the planet, earthquakes, volcanoes and tsunamis would make these places uninhabitable. We would be faced with an entirely different world than the one we know. Consider that half of the world’s population lives within 62 miles of a coast.
I believe that these experts are being generous by giving us till the end of the century. As I’ve discussed in the dangerous gas thread this threat is here and now. The increases in all these phenomenon are now and I don’t think the public is being given accurate numbers. Earthquakes have risen each year since 2007 at an alarming rate.
continued...
edit on 14-2-2013 by Rezlooper because: (no reason given)
The rise in sea level has the potential to affect some places more than others according to the Scientific American. An article published September
10, 2012 states that in some places, such as California, the impact of the rising waters will be different in the south than in the north, as well as
Oregon and Washington.
How serious is sea-level rise?
I predict that we’ll be experiencing even more earthquakes and the major earthquakes that ravaged the Solomon Islands this past week are going to become the norm. We’ve already entered a dangerous chain reaction of more methane release, causing more warmer atmospheric temperatures, causing more Arctic ice melt, causing more rising sea levels, causing more earthquakes and volcanoes, which in turn cause more methane release and round and round we go.
Let’s get back to the argument about whether earthquakes really are on the rise. Some argue that they really aren’t, we are just seeing things more clearly due to better reporting, the widespread use of the internet and all that garbage. I beg to differ. I don’t need graphs and stats to know that there is an alarming trend of small temblors all over the United States in highly unusual places. There are constant swarms of small quakes somewhere on the globe each and every day. As far as the large mega-quakes, no, they may not be on the rise…yet!
Most of my theory about the dangerous gases comes from the Jumping Jack Flash Hypothesis proposed by Johnny Mnemonic. When he initially set out to investigate his suspicions about the methane and hydrogen sulfide dangers, it was earthquakes that had originally caught his attention. Here is what he had to say in a post in the dangerous gas theory thread about how he first hypothesized the methane and hydrogen sulfide gases. It has everything to do with earthquakes.
Continued...
How serious is sea-level rise?
In California, the impact will be felt more in the south than it will in the state's north or in Oregon and Washington, Cayan said. Two trends contribute to that phenomenon, he said. The ocean plate is descending below North America at the Cascadia subduction zone, which runs from northern Vancouver Island, British Columbia, to Northern California. The land there is rising as seismic strain builds, Cayan said, making sea level rise less. It's likely not permanent, however. An earthquake with a magnitude of 8 or higher would stop the land from rising and also likely would bring about additional sea-level growth of 1 to 2 meters (3.3 to 6.6 feet) in the area, he said. "This could be a great game changer as far as sea-level rise," Cayan said. It would be "instantaneous sea-level rise of the sort Japan saw a year ago" after its magnitude-9 temblor. The other factor making sea-level rise higher in Southern California could be winds, Cayan said. There was a study that surmised east-to-west winds are driving storm surges that are pushing waters. If those winds calmed, he said, that likely would stop the comparably higher sea effect in the region.
I predict that we’ll be experiencing even more earthquakes and the major earthquakes that ravaged the Solomon Islands this past week are going to become the norm. We’ve already entered a dangerous chain reaction of more methane release, causing more warmer atmospheric temperatures, causing more Arctic ice melt, causing more rising sea levels, causing more earthquakes and volcanoes, which in turn cause more methane release and round and round we go.
Let’s get back to the argument about whether earthquakes really are on the rise. Some argue that they really aren’t, we are just seeing things more clearly due to better reporting, the widespread use of the internet and all that garbage. I beg to differ. I don’t need graphs and stats to know that there is an alarming trend of small temblors all over the United States in highly unusual places. There are constant swarms of small quakes somewhere on the globe each and every day. As far as the large mega-quakes, no, they may not be on the rise…yet!
Most of my theory about the dangerous gases comes from the Jumping Jack Flash Hypothesis proposed by Johnny Mnemonic. When he initially set out to investigate his suspicions about the methane and hydrogen sulfide dangers, it was earthquakes that had originally caught his attention. Here is what he had to say in a post in the dangerous gas theory thread about how he first hypothesized the methane and hydrogen sulfide gases. It has everything to do with earthquakes.
Continued...
Johnny was asked what he thought created the shake up to get this reaction started and what brought his attention to these events.
From Johnny Mnemonic…
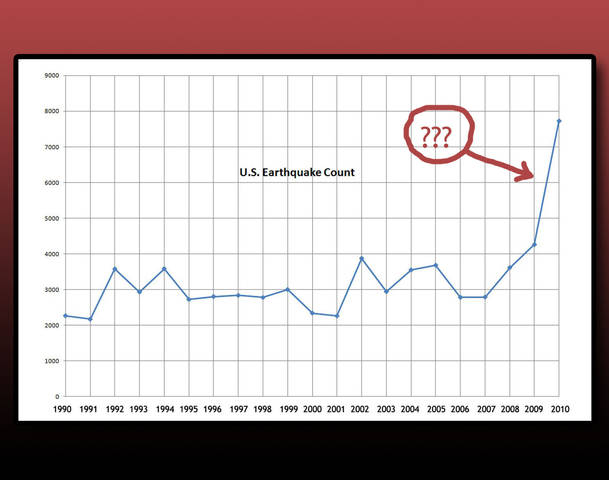
Once again, are quakes really on the rise? It used to be that the earth averaged a 6.0 quake or higher every few days, or about 120 per year. We’re averaging multiple 6.0’s every day now. Here is a graph that shows the counts per year for 6.0’s or higher up to 2010.

Notice on the chart how the big jump happened from 2006 to 2007, which correlates with my dangerous gas theory. Methane levels started rising in 2007 as did all the other strange events we are experiencing now, such as the drug-resistant bacteria and mutating viruses that I commented on in another thread.
Here is the methane levels chart…
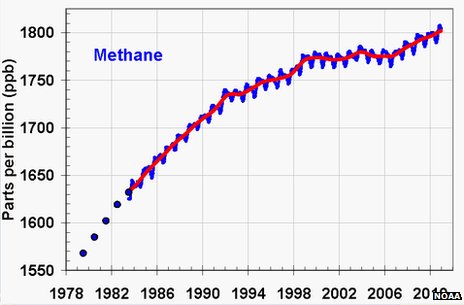
Why the rise in earthquakes? Methane increase in the atmosphere is trapping heat, which it does at 25 times the rate of carbon dioxide, and that extra heat is causing Arctic ice to melt, which when tons of ice retreat, it relieves pressure on the tectonic plates below, and at the same time, the extra water that was ice adds to sea level rise, which then causes tons of extra weight to be placed on those much more fragile plates under the sea, again causing pressure on the tectonic plates. In both cases, causing an increase in seismic activity.
From Johnny Mnemonic…
‘They’ aren’t just hiding this secret from us. This is one of several interlocking secrets. I call it the House of Hidden Truths. Once I started figuring things out, I was able to see a great way inside that house, walk the corridors, examine the hidden things. I wanted to wake people up with one of the other hidden truths, but ‘they’ have that one very well guarded. I fought the battles, came armed with information and science, and I was able to muscle my way through the front door of the secret I wanted to reveal first, but then I was tossed back out, a couple of ripples and then it was like the whole effort was rendered irrelevant. So I looked ahead and saw this methane hydrate and hydrogen sulfide event. I looked around that room and…ghost town, sagebrush blowing through, no guards there. I think they even hid this from their own agents of deception they employed to hide the other truths. Compartmentalization, that’s how they work. I would have done the same thing myself. But that made it easy for me to simply plant my flag there, snatch this secret out of the House of Hidden Truths and make it mine. By the time they realized what I’d done, it was too late. They came at me, but I fought them off, and they got weaker and I got stronger. Eventually they just faded away (which was a shame, because I liked the battles; they’d find weaknesses in my arguments or science, and then I simply corrected any errors and at the end of the day, they helped me by arguing with me.) So, back to the original question, what began it all, what got me on the trail of this mystery in the first place? It was first the rising earthquakes, the scale I made. (see chart below) That shows US quakes rising in an escalating curve. But then I looked closely at USGS and saw that in 2005 they stopped counting 2.5 or less quakes globally. Odd thing to do. Makes it hard to compare years, apples and oranges. And why do that at all? We aren’t using 8-bit computers that can’t count high enough for the number of quakes. And then in 2009 they stopped counting quakes globally that were 4.5 or below, which is about 2/3 of ALL quakes. Why do that in the first place, and why raise it? It was because the quake counts were getting alarming, so to make it LOOK more normal, at least globally, they simply stopped counting 2/3 of the quakes that were occurring. Tada, everything is normal, go back to sleep, folks! That told me the government itself was hiding something, and whatever it was, it was huge, planet-shaking (literally and metaphorically).
Once again, are quakes really on the rise? It used to be that the earth averaged a 6.0 quake or higher every few days, or about 120 per year. We’re averaging multiple 6.0’s every day now. Here is a graph that shows the counts per year for 6.0’s or higher up to 2010.
Notice on the chart how the big jump happened from 2006 to 2007, which correlates with my dangerous gas theory. Methane levels started rising in 2007 as did all the other strange events we are experiencing now, such as the drug-resistant bacteria and mutating viruses that I commented on in another thread.
Here is the methane levels chart…
Why the rise in earthquakes? Methane increase in the atmosphere is trapping heat, which it does at 25 times the rate of carbon dioxide, and that extra heat is causing Arctic ice to melt, which when tons of ice retreat, it relieves pressure on the tectonic plates below, and at the same time, the extra water that was ice adds to sea level rise, which then causes tons of extra weight to be placed on those much more fragile plates under the sea, again causing pressure on the tectonic plates. In both cases, causing an increase in seismic activity.
People keep claiming that the ocean levels are rising, all that extra water has weight to it (8 pounds per gallon) all that extra weight sloshing
around might have some effect on the earths crust, it makes sense to me.
edit on 14-2-2013 by Tardacus because: (no reason given)
If you have a cup with an ice cube in it and it melts, it is still going to weigh the same as if it were frozen.
Just because the ice melts does not mean that it's weight simply "goes away". It's just been converted from a frozen state to a liquid state.
Have you ever noticed that when ice melts in a drink, the level in the glass remains the same? The ice is displacing it's weight, and as it melts, it's weight stays the same.
reply to post by MystikMushroom
The weight is shifting from one area to another...ice melts and the water displaces into the ocean shifting weights from both plates a decrease where the ice was to an increase in the oceans.
Also, much of that ice is over land, permafrost, and that is melting as well. So this relieves pressure over the plates under this land mass.
edit on 14-2-2013 by Rezlooper because: (no reason given)
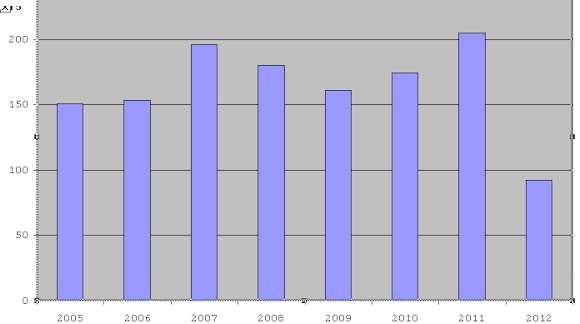
In talking about earthquakes of magnitude 6.0 you must consider the fact that there has been an increase in the number of seismic stations on the
planet. This means that it has been possible to "locate" a greater number of these earthquakes. It is only "located" earthquakes which appear in the
database. Here's the number of 7.0+ earthquakes. The ability to locate these stronger earthquakes has existed for a longer period of time.
(click the thumbnail)
Yes, we know 2010 was a big year. Sort of. But let's look at a broader perspective. Take a look at this. It's actually been pretty quiet for a couple of decades compared to the last century. Were methane levels really, really high back then?
[atsimg]http://files.abovetopsecret.com/images/member/9f995b9df942.png[/atsimg]
logical-critical-thinking.com...
(click the thumbnail)

Yes, we know 2010 was a big year. Sort of. But let's look at a broader perspective. Take a look at this. It's actually been pretty quiet for a couple of decades compared to the last century. Were methane levels really, really high back then?
[atsimg]http://files.abovetopsecret.com/images/member/9f995b9df942.png[/atsimg]
How about waiting to see how the rest of the year goes before jumping to conclusions about how it will average out?
Once again, are quakes really on the rise? It used to be that the earth averaged a 6.0 quake or higher every few days, or about 120 per year. We’re averaging multiple 6.0’s every day now.
Do you have to be reminded that correlation does not imply causation?
Why the rise in earthquakes?
logical-critical-thinking.com...
edit on 2/14/2013 by Phage because: (no reason given)
Originally posted by Phage
In talking about earthquakes of magnitude 6.0 you must consider the fact that there has been an increase in the number of seismic stations on the planet. This means that it has been possible to "locate" a greater number of these earthquakes. It is only "located" earthquakes which appear in the database. Here's the number of 7.0+ earthquakes. The ability to locate these stronger earthquakes has existed for a longer period of time.
(click the thumbnail)
Yes, we know 2010 was a big year. Sort of. But let's look at a broader perspective. Take a look at this. It's actually been pretty quiet for a couple of decades compared to the last century. Were methane levels really, really high back then?
[atsimg]http://files.abovetopsecret.com/images/member/9f995b9df942.png[/atsimg]
How about waiting to see how the rest of the year goes before jumping to conclusions about how it will average out?
Once again, are quakes really on the rise? It used to be that the earth averaged a 6.0 quake or higher every few days, or about 120 per year. We’re averaging multiple 6.0’s every day now.
Do you have to be reminded that correlation does not imply causation?
Why the rise in earthquakes?
logical-critical-thinking.com...
edit on 2/14/2013 by Phage because: (no reason given)
Good points about the seismic stations, will take into consideration. But, I apologize for sending some sort of message that I'm implying that all quakes are caused by this proposed theory, which is not mine by the way. Not the intention. What I am proposing is that this theory of relieved pressure or added pressure to the plates makes since in contributing in a major way for the rise in quakes since 2007.
reply to post by Rezlooper
6.0+ Earthquakes:
There has been no rise "since 2007". There have been fluctuations in the number of earthquakes just like there always are.
What I am proposing is that this theory of relieved pressure or added pressure to the plates makes since in contributing in a major way for the rise in quakes since 2007.
6.0+ Earthquakes:
edit on 2/14/2013 by Phage because: (no reason given)
reply to post by Phage
It's funny but everyone's graphs are always different. You just don't know who to believe anymore. I can bet though for TPTB, they have plenty of reasons to fudge the numbers as not to be alarmist, especially if there is any truth to these theories. If these theories are accurate about the dangerous gases, there would be a lot of frightened people, so you can bet that 'They' wouldn't be very forthcoming. Every attempt would be made to hide the truth, so even if earthquake numbers were rising, common folk would be the last to know. For example, Quake Watch is through the roof with activity but you're telling me it's not. It's like pissing on me and telling me it's raining as if I wouldn't know the difference, but hey, this is just the 'conspiracy theorist' side of me talking now!
It's funny but everyone's graphs are always different. You just don't know who to believe anymore. I can bet though for TPTB, they have plenty of reasons to fudge the numbers as not to be alarmist, especially if there is any truth to these theories. If these theories are accurate about the dangerous gases, there would be a lot of frightened people, so you can bet that 'They' wouldn't be very forthcoming. Every attempt would be made to hide the truth, so even if earthquake numbers were rising, common folk would be the last to know. For example, Quake Watch is through the roof with activity but you're telling me it's not. It's like pissing on me and telling me it's raining as if I wouldn't know the difference, but hey, this is just the 'conspiracy theorist' side of me talking now!
Arctic ice is receding, this is redistributing weight.
I fail to see how anyone can not reason that this will result in more earthquakes?
So we have been adding more seismic sensors for years and this screws with the numbers, also excluding eq's below certain magnitudes....twice....
Excuse my ignorance but are they increasing? Has not science come up with accurate graphs?
have they released how they calculate eq trends in these graphs taking an increse of monitors into consideration? has nobody taken the time to cross check how the current and past eq trends are calculated by those who release these graphs?
I am sure I could answer some of these questions with google but I also wanted to say thanks to the op, I remember reading your post on the gas build up, keep researching and an open mind. I appreciate people who help others ask the right questions.
ETA: is there a chart showing the yearly increase of seismic monitors? Would this help find an accurate trend?
edit on 14-2-2013 by criticalmindseed because: (no reason given)
reply to post by Rezlooper
The graph is the same as yours. It's the same data, it's just in fuller context.
You just limit your view to 2007 to 2010 for some reason. But look at your graph. What about that "increase" between 1989 and 1992? Why ignore that? Why ignore the "decline" between 1983 and 1989?
I'll tell you why. It's because you are selecting data that supports your "theory" and ignoring that which doesn't. That makes it easy to find correlations that don't exist.
It's funny but everyone's graphs are always different.
The graph is the same as yours. It's the same data, it's just in fuller context.
You just limit your view to 2007 to 2010 for some reason. But look at your graph. What about that "increase" between 1989 and 1992? Why ignore that? Why ignore the "decline" between 1983 and 1989?
I'll tell you why. It's because you are selecting data that supports your "theory" and ignoring that which doesn't. That makes it easy to find correlations that don't exist.
edit on 2/14/2013 by Phage because: (no reason given)
new topics
-
Cold Blooded Killers on Christmas!! GRRRRrrr!!
Pets: 1 hours ago -
Plane Crash Today --Azerbaijanian E190 passenger jet
Mainstream News: 5 hours ago -
Orange County Makes Shoplifting a Felony
Other Current Events: 10 hours ago
top topics
-
Orange County Makes Shoplifting a Felony
Other Current Events: 10 hours ago, 16 flags -
It's Offical Now
US Political Madness: 12 hours ago, 14 flags -
The reason it works is.....
General Chit Chat: 12 hours ago, 8 flags -
Dick Van Dyke saved from Wildfire by neighbours on his 99th birthday
People: 15 hours ago, 7 flags -
Plane Crash Today --Azerbaijanian E190 passenger jet
Mainstream News: 5 hours ago, 5 flags -
Cold Blooded Killers on Christmas!! GRRRRrrr!!
Pets: 1 hours ago, 3 flags
active topics
-
Political Warfare & The Resister Special Forces Underground
Political Ideology • 2 • : NoCorruptionAllowed -
London Christmas Market BANS Word ‘Christmas’
Social Issues and Civil Unrest • 49 • : NorthOS -
Cold Blooded Killers on Christmas!! GRRRRrrr!!
Pets • 3 • : Lumenari -
Post A Funny (T&C Friendly) Pic Part IV: The LOL awakens!
General Chit Chat • 7956 • : KrustyKrab -
Plane Crash Today --Azerbaijanian E190 passenger jet
Mainstream News • 10 • : yuppa -
Drones everywhere in New Jersey ---and Elsewhere Master Thread
Aliens and UFOs • 229 • : yuppa -
It's Offical Now
US Political Madness • 14 • : BernnieJGato -
DefCon Teetering on Escalation
World War Three • 49 • : ADVISOR -
Orange County Makes Shoplifting a Felony
Other Current Events • 22 • : FeeshJefe -
The reason it works is.....
General Chit Chat • 4 • : randomuser2034
4