It looks like you're using an Ad Blocker.
Please white-list or disable AboveTopSecret.com in your ad-blocking tool.
Thank you.
Some features of ATS will be disabled while you continue to use an ad-blocker.
6
share:
As much as I hate the Democrats, when it comes to liberal vs. conservative economic policies, it is clear as day which is better if you look at
historical statistics.
Unemployment Rates (earliest data available is 1900. Data from Bureau of Labor Statistics & US Department of Labor)
Republican Era's
McKinley, T. Roosevelt, Taft (1900-12) -- 5.0 to 5.9 (+.9)
Harding, Coolidge, Hoover (1921-32) -- 5.2 to 22.9 (+17.7)
Eisenhower (1953-60) -- 3.0 to 5.5 (+2.5)
Nixon, Ford (1969-76) -- 3.6 to 7.7 (+4.1)
Reagan, Bush (1981-92) -- 7.2 to 7.5 (+.3)
Bush Jr. (2001-8) -- 4.0 to 5.8 (+1.8)
Net change: +27.3%
Democrat Era's
Wilson (1913-20) -- 5.9 to 5.2 (-.7)
FDR, Truman (1933-52) -- 22.9 to 3.0 (-19.9)
JFK, LBJ (1961-68) -- 5.5 to 3.6 (-1.9)
Carter (1977-80) -- 7.7 to 7.2 (-.5)
Clinton (1993-2000) -- 7.5 to 4.0 (-3.5)
Net change: -26.5%
Average Weeks Unemployed (earliest data available is 1948, latest is 2003 via same sources)
Republican Era's
Eisenhower (1953-60) -- 8.4 to 12.8 (+4.4)
Nixon, Ford (1969-76) -- 8.4 to 15.8 (+7.4)
Reagan, Bush (1981-92) -- 11.9 to 17.7 (+5.8)
Bush Jr. (2000-3) -- 12.6 to 19.6 (+7.0)
Net change: +24.6 weeks
Democrat Era's
Truman (1948-52) -- 8.6 to 8.4 (-.2)
JFK, LBJ (1961-68) -- 12.8 to 8.4 (-4.4)
Carter (1977-80) -- 15.8 to 11.9 (-3.9)
Clinton (1993-2000) -- 17.7 to 12.6 (-5.1)
Net change: -13.6 weeks
So much for the "welfare queen" myth, huh?
Recession Stats (National Bureau of Economic Research -- recently run by a conservative economic adviser for a number of Republican presidential candidates -- Martin Feldstein)
Months of Recessions from 1900 to 2010
Republicans: 246
Democrats: 86
The statistical probability of these results happening by chance is 1 in 10,000. Adjusted per year in office, Republicans still had 2.3 times as many months of recession.
Average Length of Recessions
Republicans: 14.2
Democrats: 9.8
Number or Recessions Caused by Party
Republicans: 17
Democrats: 6
Recessions Inherited by Other Party
Republicans: 1
Democrats: 4
Months Inherited by Other Party
Republicans: 4
Democrats: 27
Recessions have historically been 3 times as frequent and 45% longer under Republicans, and led to 4 times as many years of recession as occurred during those under Democrats (20 years vs. less than 5). Republicans were 4 times as likely to pass a recession on to Democrats. When passed on, Republican recessions were harder to get out of than recessions started by Democrats.
The same source found that during Democrat administrations, GDP grew 86% of the time vs. 66% under Republicans.
National Violent Death Rates (Age-adjusted violent deaths per 100,000 per year. Each point = 3,000 additional violent deaths proportional to our current population, for perspective. Source (originally sorted by year, not party): Holinger, Violent Deaths in the United States. The term "epidemic" was used for rates higher than the mean of 19.4)
Republican Era's
McKinley, T. Roosevelt, Taft -- 15.6 to 21.9 (+6.3)
Harding, Coolidge, Hoover -- 17.4 to 26.5 (+9.1)
(Stayed virtually the same under [R] Eisenhower through [D] JFK, [D] LBJ statistically considered below epidemic levels)
Nixon -- 15 to 23.2 (+8.2)
(It continued to fluctuate between 19.9 and 22.4 between [R] Reagan and [R] Bush Sr., statistically considered epidemic levels)
Bush Jr. -- 16 to 17.2 (+1.2)
Democrat Era's
Wilson -- 21.9 to 17.4 (-4.5)
FDR, Truman -- 26.5 to 15 (-11.5)
Clinton -- 21.7 to 16 (-5.7)
Democrat Jimmy Carter was the ONLY Democratic "Era" that failed to bring an epidemic level of violence to below the mean. By contrast, Republican Dwight Eisenhower was the only Republican "Era" not to bring non-epidemic violence to above the mean.
*It should be noted that even the rates under Democrat Era's were FAR higher than the rest of the industrialized world, for the most part*
Red States vs. Blue States in Violent Deaths (Source: National Center for Health Statistics, Centers for Disease Control and Prevention, U.S. Public Health Services, "CDC --Injury -- WISQARS (Web-Based Injury Query and Reporting System)" Once again deaths are counted per 100,000.)
2000
Red States (Republican): 5.7 homicides, 13.0 suicides
Blue States (Democrat): 4.23 homicides, 10.0 suicides
p value = .064 for homicides*, .001 for suicides, both taken together have a p value of .000
*A p value of .064 is not statistically significant, but it's damn close. Statistical significance requires an overlap of less than 5%. Suicides certainly made the mark of statistical significance here as did both taken together with ease.
2004
Red States (Republican): 5.70 homicides, 13.9 suicides
Blue States (Democrat): 4.01 homicides, 10.2 suicides
p value = .021 for homocides, .000 for suicides, both taken together have a p value of .000
Strong statistical significance on all comparisons this time.
In other words: Economic Conservatism Fails
We'll see how Romney 2012 - 2016 works out.
It can't be worse than the Treasonist, Liar in Chief, Czar appointing, Constitution subverting, Gun running, Liberal Socialist, "God Damn American", Islamic Extremist Loving Obama
Best wishes for Hillary in 2016. By then we might know the full extent of Obama's lies regarding Benghazi (unless he somehow gets re-elected in which case we'll impeach him).
Let's look at something more recent.
Republicans for the most part had control of Congressional Committees from Jan 2001 to Jan 2007.
Unemployment peaked down to 4.4% in Oct 2006 from a high of 6.3% in June 2003.
Democrats took control of Congress in Jan 2007 (the Harry Reid - Nancy Pelosi steam engine).
Unemployment started spiking up since mid 2007.
Maybe no correlation, but why would the "Failed" economic policies from 2001 to 2007 show such good results ?
And why on Earth would Republicans be so hell bent on destroying those good results ?
Very confusing. What went wrong ? What changed ?
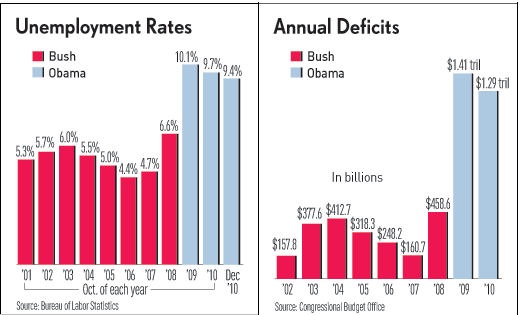

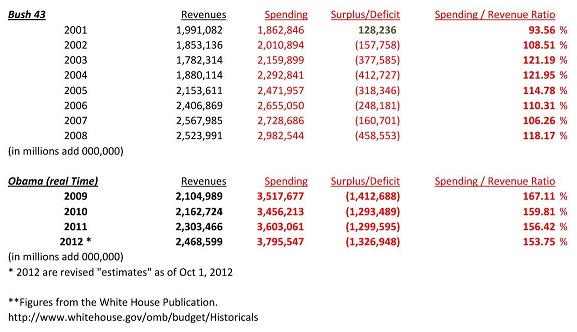
And can someone explain why the spending deficit showed such a wild increase from 2008 to 2009 ? (A 300% + increase)
The revenue decrease was only $419 billion.
The deficit increase was $954 billion
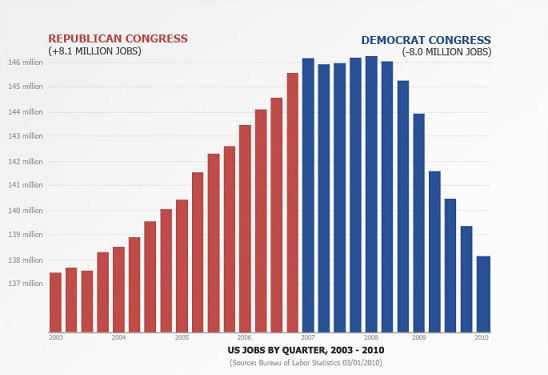
Republicans for the most part had control of Congressional Committees from Jan 2001 to Jan 2007.
Unemployment peaked down to 4.4% in Oct 2006 from a high of 6.3% in June 2003.
Democrats took control of Congress in Jan 2007 (the Harry Reid - Nancy Pelosi steam engine).
Unemployment started spiking up since mid 2007.
Maybe no correlation, but why would the "Failed" economic policies from 2001 to 2007 show such good results ?
And why on Earth would Republicans be so hell bent on destroying those good results ?
Very confusing. What went wrong ? What changed ?


And can someone explain why the spending deficit showed such a wild increase from 2008 to 2009 ? (A 300% + increase)
The revenue decrease was only $419 billion.
The deficit increase was $954 billion

reply to post by Synergy23
Lots of goodies in the OP.
I don't suppose we can get some actual backup for all the numbers ?
Some of this could be true ..... but let's double check and see just the same eh ?
Lots of goodies in the OP.
I don't suppose we can get some actual backup for all the numbers ?
Some of this could be true ..... but let's double check and see just the same eh ?


Historically, congress has less statistical significance on economic factors than the party holding presidential office.
Originally posted by Synergy23
Historically, congress has less statistical significance on economic factors than the party holding presidential office.
Interesting.
But can you back up your claims.
Most members here may not be Harvard or Yale graduates.
I myself need as much proof as possible.
It's not easy to just take your good word.
Look what happened when people took Obama at his good word
Originally posted by xuenchen
Originally posted by Synergy23
Historically, congress has less statistical significance on economic factors than the party holding presidential office.
Interesting.
But can you back up your claims.
Most members here may not be Harvard or Yale graduates.
I myself need as much proof as possible.
It's not easy to just take your good word.
Look what happened when people took Obama at his good word
I don't expect people to take my word. The public records are there for anyone to review. Admittedly, I can't find my notes with the congressional p-values (I did much of this months ago, just felt like sharing). However, you can easily look into it yourself. I provided the sources. I did enough typing and calculating for today, thank you.
I don't support Obama (Green Party for me), I was merely interested in the differences between liberal and conservative economic policies historically on a number of factors. The official non-partisan statistics I cited appeared to agree with the larger findings of Richard Wilkinson, et al on the social impact of inequality.
(www.youtube.com...)
One thing I want to emphasize, however, is that the start and end rates were averages of all 12 months to account for natural fluctuations of the business cycle. George Bush Jr., in particular, benefited from this process by almost 3% as the unemployment rose most sharply the last few months of his term during the start of the 2008 recession.
thanks xuenchen and elmo!
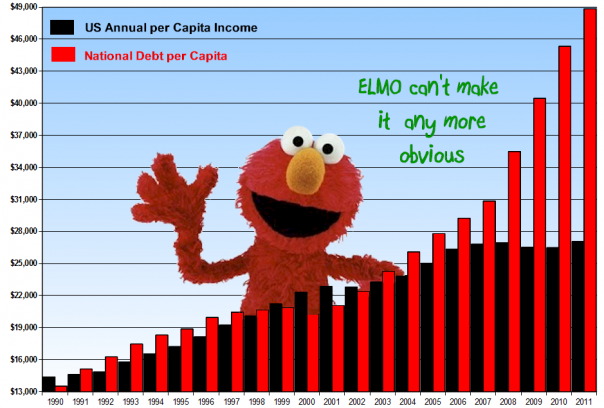
Now, Elmo, corellation does not mean caustaion, right?
So can you explain what the causation between higher government debt and lower income is?
Ok: silly Idea here, since I am not as smart as elmo:
Gov Collects taxes as a % of income.
Gov porvides income by giving money to folks.
Income falls, gov collects less $
Continues to provide $
Deficits go up?
Can you do it in the other direction? (Hint: you can't) (Edit: protip: If you worry about the deficit, vote Obama. If Mitt gets elected you won't hear a word about the deficit for 4 years.)
edit on 5-11-2012 by narwahl because: (no reason given)
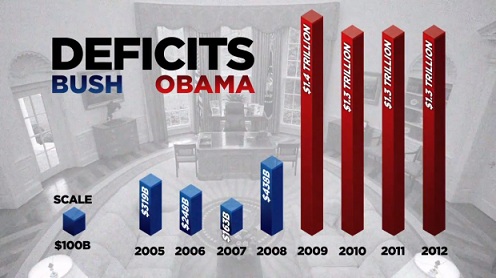
The Bush war spending was not counted to the deficit until the Obama administration added them. This graph shows a more accurate depiction no Elmo
though.

you stated reagan had a 7+% unemployment? get your facts straight, even wikipedia has more truth than this crap
Carter left him with 7.3%, he DROPPED IT TO 5.4% and SPENT LESS THAN CARTER! then bush sr brought it back up to 7+% and SPENT MORE THAN REAGAN!
get your facts straight before you misinform people please.
Thanks
Carter left him with 7.3%, he DROPPED IT TO 5.4% and SPENT LESS THAN CARTER! then bush sr brought it back up to 7+% and SPENT MORE THAN REAGAN!
get your facts straight before you misinform people please.
Thanks
Also: If you vote Obama and every teabagger possible for congress, you will solve the Euro Crisis!
Please, please do that!
They will kill the american bond market, by staging another meaningless "We spent it, but we didn't mean to" "Debtceiling crisis". That will lower borrowing costs for the PIGS, and we can finally go on with our lives here.
And don't start a war with iran, they are pretty next door to here, and they have missiles...
reply to post by xuenchen
Why was the defecit increased? You mean to say that you forgot that TRAP was enacted in the end of 2008 and 2009 was the first year that trillion dollars went onto the US bill?
Oh that's right, selective memory when it comes to politics.
Why was the defecit increased? You mean to say that you forgot that TRAP was enacted in the end of 2008 and 2009 was the first year that trillion dollars went onto the US bill?
Oh that's right, selective memory when it comes to politics.
reply to post by Eavel
The focus was conservative vs. liberal economic policy. As such, it is more relevant to observe the party affiliation of presidential era's as opposed to individuals.
Reagan had 10 months of an unemployment rate above 10% during his presidency, and 19 months of 9% or more. It began 1982 and ended in 1984.
edit on 5-11-2012 by Synergy23 because: (no reason given)
Originally posted by Synergy23
Historically, congress has less statistical significance on economic factors than the party holding presidential office.
Actually the complete opposite is true. Presidents do not draft law, regulation or set monetary policy. Congress does.
reply to post by Grimpachi
Again completely false. The deficit/debt is calculated by total outstanding Treasuries or Intra-Governmental Loans.
You can't hide it. It's always there.
Bush's war spending was not in a "budget" it was a specially drafted legislation authorizing spending. But was still counted to the deficit, and any debts incurred tallied by the Treasury.
Obama did not add war spending to a budget, but rather added the budget to a specially drafted legislation authorizing spending.
Obama has never had a budget.
Originally posted by Evil_Santa
reply to post by xuenchen
Why was the defecit increased? You mean to say that you forgot that TRAP was enacted in the end of 2008 and 2009 was the first year that trillion dollars went onto the US bill?
Oh that's right, selective memory when it comes to politics.
Are you sure the TARP money went on the books as "spending" ?
I thought the TARP was a loan deal.
Anyway it wasn't that much as to add such a huge increase to the Federal deficit.
In the fall of 2008 when the federal government pumped tens of billions of dollars into America’s biggest bank, some expected it might never see any of that money back. That has proven not to be the case, and the latest update from the Congressional Budget Office projects the Troubled Asset Relief Program (TARP) will ultimately wrap up at a cost of $24 billion.
The TARP, initially positioned as a pool of money to purchase toxic mortgage assets from banks, was ultimately used to inject capital directly into financial institutions in return for preferred equity stakes. The investments started with the biggest Wall Street firms — Citigroup, Bank of America, Merrill Lynch, Morgan Stanley, JPMorgan Chase, Wells Fargo, Goldman Sachs, etc. — in the wake of the Lehman Brothers collapse in 2008.
CBO Updates TARP Tally: $24B Cost To Taxpayers ($14B From AIG)
The first thing to know is that when we say FY2009 -- which the MarketWatch writer charges to the Bush Administration -- it measures spending for the dates 10/1/2008 to 9/30/2009. Obama's stimulus package added $185 billion to the FY 2009 deficit, all of which the writer is assigning to Bush.
TARP added $368 billion to the deficit in 2009 that did not happen in 2010. Jed Graham wrote in 2010 that the Obama Administration had overstated the cost of TARP by $100 billion, which also then gets charged to the Bush Administration by the MarketWatch piece. And TARP in general put all of its costs in 2009 then adds revenue as loans are repaid and assets sold off later on. TARP distorts the data used in the story. These data are from CBO, in billions.
Painting the TARP
Lots of confusion eh ?

reply to post by Rockpuck
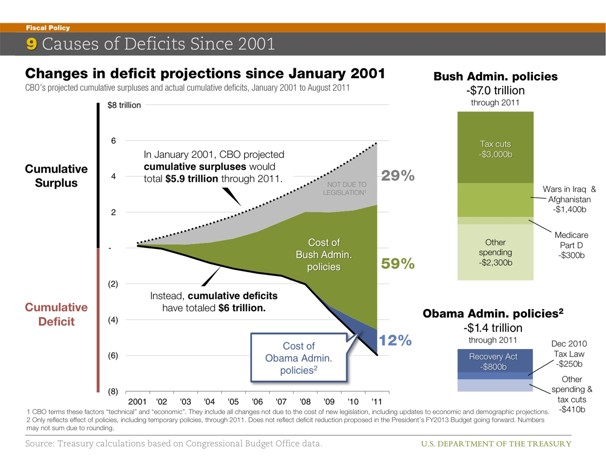
From 2001 to 2009, Bush's policies, including two wars, higher Pentagon spending in addition to those wars, tax cuts, higher discretionary spending and the prescription drug program contributed $5.1 trillion to the nation's debt. From 2009 to 2017 (using projections for 2011-2017), Obama's policies have added or will add $983 billion. Not even in the same ballpark.
U.S. military has largely paid for the wars in Iraq and Afghanistan through emergency spending measures, in effect keeping wartime costs off the books. In addition to masking skyrocketing budget growth at the Department of Defense, this process has allowed the services to treat budget supplementals as a piggy bank for new procurement.
[url]http://www.dailykos.com/story/2012/02/02/1060866/-Bush-beats-Obama-s-deficit-spending-by-5-to-1-but-Romney-targets-the-wrong-guy-to-whine-about[/ url]
From 2001 to 2009, Bush's policies, including two wars, higher Pentagon spending in addition to those wars, tax cuts, higher discretionary spending and the prescription drug program contributed $5.1 trillion to the nation's debt. From 2009 to 2017 (using projections for 2011-2017), Obama's policies have added or will add $983 billion. Not even in the same ballpark.
U.S. military has largely paid for the wars in Iraq and Afghanistan through emergency spending measures, in effect keeping wartime costs off the books. In addition to masking skyrocketing budget growth at the Department of Defense, this process has allowed the services to treat budget supplementals as a piggy bank for new procurement.
Here are the calculations:
For Bush: $1.812 trillion from the "Bush tax cuts"; $853 billion from the wars in Iraq and Afghanistan; $616 in higher Pentagon spending outside those wars; $608 billion in non-defense discretionary spending; $480 billion in "other tax"-related matters; $293 billion in entitlement changes; $224 billion in spending for Trouble Assets Relief Program (TARP) and the Housing and Economic Recovery Act; and $180 billion for the prescription drug bill.
For Obama: $874 billion for the American Reinvestment and Recovery Act (the stimulus package); $620 billion for the two-year extension of the Bush tax cuts; $324 in "other mandatory spending"; and $113 billion in "other revenue." Subtotal: $1.931 trillion. Subtracted from that are policies that reduce the net deficit: $502 billion in automatic spending cuts; $271 reduction in defense spending; $123 billion in reduced health care spending; $51 billion in reduced non-defense discretionary spending. Total: $983 billion.
[url]http://www.dailykos.com/story/2012/02/02/1060866/-Bush-beats-Obama-s-deficit-spending-by-5-to-1-but-Romney-targets-the-wrong-guy-to-whine-about[/ url]
reply to post by Synergy23
You also need to account for the fact that the old republicans are the new democrats and vis versa. And you need to quantify which side a bad economy was actually good or bad for. For example the 2008 Republican decline was actually good for the upper classes while bad for the overall economy.
You also need to account for the fact that the old republicans are the new democrats and vis versa. And you need to quantify which side a bad economy was actually good or bad for. For example the 2008 Republican decline was actually good for the upper classes while bad for the overall economy.
reply to post by sligtlyskeptical
I focused on the overall economy, obviously. Good point on the consistency of philosophy. If anyone can provide me evidence that they were reversed in the early 1900s in economic policy, I would love to see it. I feel that the republican philosophy was less consistent with today upon its inception in the 1800's, but by the early 1900's was very similar to today. One issue I feel like is really slipping through the cracks here are the violent death rates that resulted. The results were statistically significant, even when broken down into red vs. blue states (according to 2000 and 2004 election statistics).
I focused on the overall economy, obviously. Good point on the consistency of philosophy. If anyone can provide me evidence that they were reversed in the early 1900s in economic policy, I would love to see it. I feel that the republican philosophy was less consistent with today upon its inception in the 1800's, but by the early 1900's was very similar to today. One issue I feel like is really slipping through the cracks here are the violent death rates that resulted. The results were statistically significant, even when broken down into red vs. blue states (according to 2000 and 2004 election statistics).
edit on 5-11-2012 by Synergy23 because: (no reason given)
reply to post by Eavel
Sorry, no. You are misinforming people. Unemployment rose as high as 9.7% under Raygun (as the annual average of 1982), and was in the teens in some areas of the country.
Annual unemployment
Sorry, no. You are misinforming people. Unemployment rose as high as 9.7% under Raygun (as the annual average of 1982), and was in the teens in some areas of the country.
Annual unemployment
new topics
-
Tesla Cybertruck Explodes in Front of Trump Hotel in Las Vegas
Mainstream News: 46 minutes ago -
Maybe they didn't get away with it: The Lincoln-Kennedy assassination parallels. 7 sentences long.
History: 3 hours ago -
Ukraine halts transit of Russian gas to Europe after a prewar deal expired
Political Conspiracies: 7 hours ago -
Welp...Happy New Year!!
General Chit Chat: 9 hours ago -
Vehicle Strikes people in New Orleans
Mainstream News: 10 hours ago -
The Hand that Rocks the Cradle - Labour Plans “diversities of our society” Curriculum Change
Regional Politics: 10 hours ago
top topics
-
Vehicle Strikes people in New Orleans
Mainstream News: 10 hours ago, 22 flags -
Ukraine halts transit of Russian gas to Europe after a prewar deal expired
Political Conspiracies: 7 hours ago, 9 flags -
Welp...Happy New Year!!
General Chit Chat: 9 hours ago, 7 flags -
The Hand that Rocks the Cradle - Labour Plans “diversities of our society” Curriculum Change
Regional Politics: 10 hours ago, 6 flags -
Tesla Cybertruck Explodes in Front of Trump Hotel in Las Vegas
Mainstream News: 46 minutes ago, 5 flags -
Maybe they didn't get away with it: The Lincoln-Kennedy assassination parallels. 7 sentences long.
History: 3 hours ago, 2 flags
active topics
-
Tesla Cybertruck Explodes in Front of Trump Hotel in Las Vegas
Mainstream News • 7 • : xuenchen -
Maybe they didn't get away with it: The Lincoln-Kennedy assassination parallels. 7 sentences long.
History • 8 • : Dalamax -
Ukraine halts transit of Russian gas to Europe after a prewar deal expired
Political Conspiracies • 96 • : BedevereTheWise -
-@TH3WH17ERABB17- -Q- ---TIME TO SHOW THE WORLD--- -Part- --44--
Dissecting Disinformation • 3878 • : xuenchen -
Vehicle Strikes people in New Orleans
Mainstream News • 190 • : Vermilion -
Get Ready - Here comes the Bird Flu Pandemic - Millions are Notified
Diseases and Pandemics • 61 • : Oldcarpy2 -
I dont understand what i just witnessed
Social Issues and Civil Unrest • 27 • : Oldcarpy2 -
Post A Funny (T&C Friendly) Pic Part IV: The LOL awakens!
General Chit Chat • 7976 • : underpass61 -
New UK Petition - Close the borders! Suspend ALL immigration for 5 years!
Regional Politics • 20 • : gortex -
US disburses $3.4 billion in budget aid for Ukraine, Yellen says
US Political Madness • 24 • : StudioNada
6
