It looks like you're using an Ad Blocker.
Please white-list or disable AboveTopSecret.com in your ad-blocking tool.
Thank you.
Some features of ATS will be disabled while you continue to use an ad-blocker.
share:
Magnitude ML 3.8
Region SPAIN
Date time 2012-03-28 17:22:41.0 UTC
Location 37.17 N ; 4.33 W
Depth 20 km
Distances 365 km S Madrid (pop 3,117,977 ; local time 19:22:41.2 2012-03-28)
51 km N Málaga (pop 550,058 ; local time 19:22:41.2 2012-03-28)
16 km W Loja (pop 20,843 ; local time 19:22:41.2 2012-03-28)
1 km S Villanueva de tapia (pop 1,695 ; local time 19:22:41.2 2012-03-28)
www.emsc-csem.org...
Locatio n
Near the 5 that caused fatalities? I think so.
reply to post by redtic
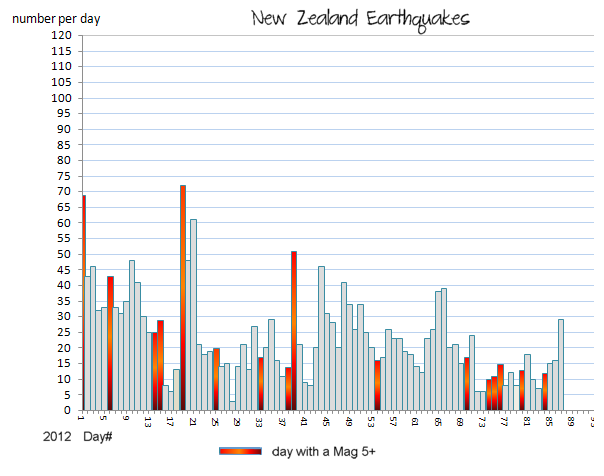
Of course it would be different if it only ran to 10th March but it is NOT skewed by a single event it is skewed by hundreds of events. There was only 1 mag nine and this is showing counts of numbers. I have already shown on this thread what a massive energy release the Mag 9.1 was.
There was no particular point hence I called it a doodle. It merely shows that (obviously) this year is much quieter than last. Bear in mind however that many people say that the number of earthquakes is increasing still. Perhaps the point was to show that they are not. The other 'point' is of course that this is an earthquake thread and thus earthquake statistics are relevant.
As it happens if you compared up to the 10th you would find this:
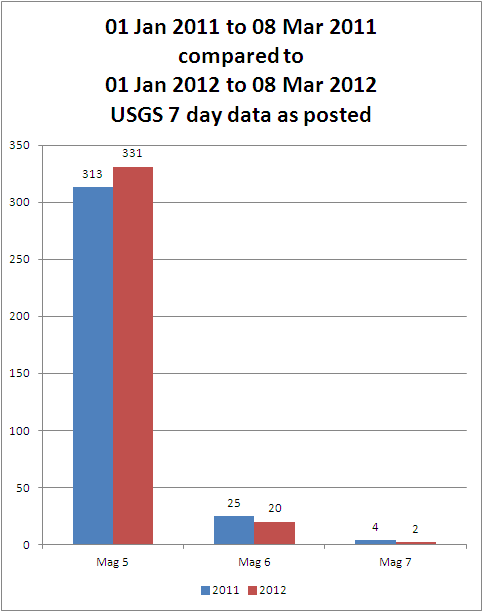
But the energy would be this. Note neck and neck on energy for the Mag 5s:
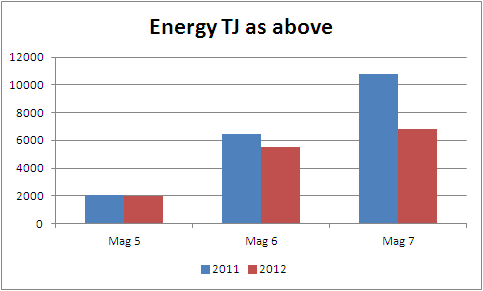
You don't like my doodles?
What is your point with this graph? It's obviously skewed from a single event. I suspect it'd be a rather mundane graph if you did Jan 1 thru Mar 10.
Of course it would be different if it only ran to 10th March but it is NOT skewed by a single event it is skewed by hundreds of events. There was only 1 mag nine and this is showing counts of numbers. I have already shown on this thread what a massive energy release the Mag 9.1 was.
There was no particular point hence I called it a doodle. It merely shows that (obviously) this year is much quieter than last. Bear in mind however that many people say that the number of earthquakes is increasing still. Perhaps the point was to show that they are not. The other 'point' is of course that this is an earthquake thread and thus earthquake statistics are relevant.
As it happens if you compared up to the 10th you would find this:

But the energy would be this. Note neck and neck on energy for the Mag 5s:

You don't like my doodles?
reply to post by muzzy
My approximate target area for the Northern one. Has a bit of Peru in it. Possibly could be off shore however.
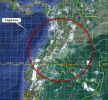
My approximate target area for the Northern one. Has a bit of Peru in it. Possibly could be off shore however.

edit on 28/3/2012 by PuterMan because: (no reason given)
Someone mentioned the other day that the number of quakes in California was on the rise, some 53/24hr period.
Also NZ quakes went up on the 27th from a low run of
23rd - 8
24th - 12
25th - 15
26th - 16
27th - 29
they were "scattered" all over, so not a swarm in one spot.
Haven't had time to do any graph updates, but looks at first glance the 27th was an upsurge Globally.
Not sure why, Moon is not in any particular phase. No CME's?
Would be interesting to see if Greece, Chile or Turkey also had an upsurge.
reply to post by muzzy
Here is California. Question is does coming down from 70 to go back up count as an increase?
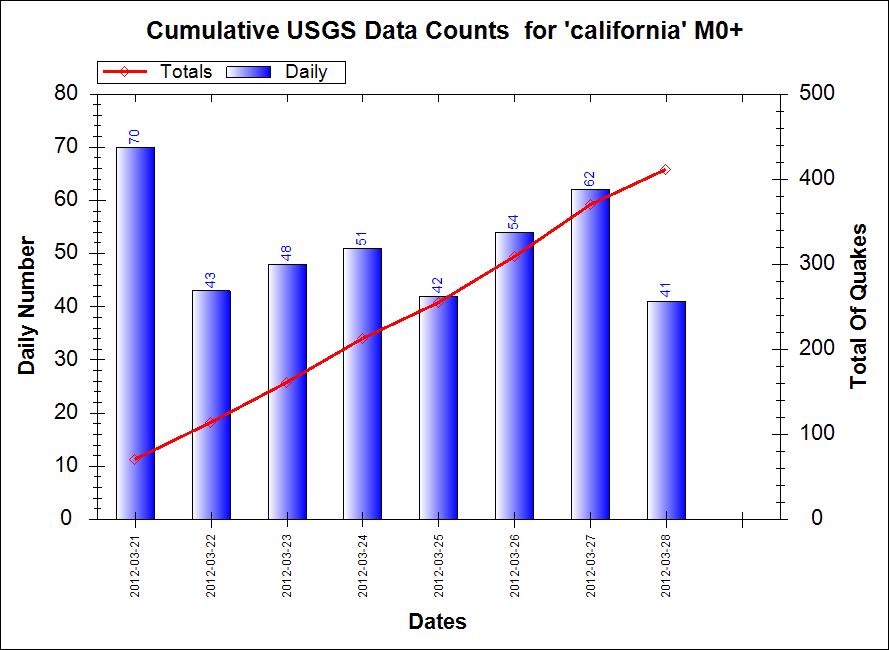
Here is California. Question is does coming down from 70 to go back up count as an increase?

reply to post by vister74
Welcome to ATS and in particular to Quake Watch.
Here you will find some of the best information about earthquakes on the Internet. Why do I say that? Because the members who frequent this thread, and those who lurk and occasionally stick their heads up into the firing line on the whole produce excellent work that is based on facts.
You will find some of the alternative geophysical theories on this thread: Geophysics which is hosted by Zenius who you will also see on this thread.
Anything of a speculative nature to do with Yellowstone / Fracking / Arkansas / Bird Deaths / Hudson Bay / Life / Death / Resurrection / the Economy / Politics / Religion etc you can post on the thread hosted by Robin Marks/Eric Blair: Robinesque Ruminations
Volcano stuff you will find on Volcano Watch and last but by no means least the giant Yellowstone thread is a BIG read all about the Park that has passed page 700.
These and more ATS links, and links to many external sites you can find in my signature block and in the signatures of others.
Never be afraid to ask a question. We will always try to answer, and no one gets ridiculed here because of a lack of knowledge on what is a complex and multifaceted subject. (Well not if the question is reasonable at least!)
As regards the Mag 4.2 in Alaska if you are posting an earthquake on the thread you need to give some source link for where you found the data and for one of that size preferably a reason as to why it may be significant.
You may find these guidelines on posting on Quake Watch useful.
Is it not enough to exist?
www.fox11online.com...
If a tree falls in the forest?
wtaq.com...
The last article has the awesome generic EARTHQUAKE picture.
I'd like a t-shirt please.
Damn. Why be rational? I can't split the difference between preception and reality anymore.
It's glacial rebound.
That's my story and I'm sticking to it.
Swears. You're lying. YOu don't even believe yourself.
Tru DA.
4
EVA
Originally posted by PuterMan
reply to post by muzzy
Here is California. Question is does coming down from 70 to go back up count as an increase?
Well there you go, perception can be a funny thing, and it depends on how far advanced the Dementia is and how many days back you look
So the original poster was right but only over the previous 3 days.
NZ however showed a doubling of numbers over one day, and a trebling over 4 days
Hi PuterMan,
Would you have a quick eyeball of these and tell me if they are all along the Great Glenn Fault please?
I don't have access to the maps you do and I would very much appreciate if you could tell me. Because if they are, I might have to reconsider my timescale for moving up to Scotland before they get Independence in more ways than one!
2012/03/24 11:06:30.9 60.597 6.363 23 3.3 SOUTHERN NORWAY
2012/03/24 06:05:19.4 60.613 4.467 28 3.3 SOUTHERN NORWAY
2012/03/23 22:11:31.2 55.781 -6.411 9 1.3 ISLAY,ARGYLL/BUTE
2012/03/14 19:22:28.1 59.530 5.517 18 3.6 5 SOUTHERN NORWAY FELT SOUTHERN NORWAY
2012/03/14 00:01:48.0 55.096 -7.557 2 0.7 2 BUNCRANA,IRELAND FELT MILFORD
2012/03/13 21:22:03.1 55.112 -7.529 3 1.0 2 BUNCRANA,IRELAND FELT MILFORD
Rainbows
Jane
reply to post by angelchemuel
You don't need to be worrying about the quakes in Norway since they are not on the Great Glen, or it's continuation North East which turns up towards the Shetlands and becomes the Walls Boundary Fault.
Page 16 of this PDF shows you a diagram of the fault and the connection to the Great Glen. A USGS publication by the way!
As for the others, yes they are connected to the Great Glen fault line.
Ye might like this
Scotland - Independence? Idiots. Alex should be put away. It will do them no good and most of them know it, but that is for another thread. I left Scotland 1996, and very glad I did.
edit on 29/3/2012 by PuterMan because: (no reason given)
reply to post by PuterMan
Thank you PuterMan, I am saving that PDF so I have it for future referal!
Rainbows
Jane
Thank you PuterMan, I am saving that PDF so I have it for future referal!
Rainbows
Jane
thank you, il try and be more precise and infomative its myself i dont know my way fully around computers yet, i got the alaska info from us geo
survay, iv been in an out of there at all hours since someone mentioned it! lol thanks for the support
Magnitude 5.0 - SOUTHEAST OF EASTER ISLAND
2012 March 30 06:19:32 UTC
Versión en Español
Details
Maps
Scientific & Technical
Tsunami
Earthquake Details
This event has been reviewed by a seismologist.
Magnitude
5.0
Date-Time
Friday, March 30, 2012 at 06:19:32 UTC
Thursday, March 29, 2012 at 11:19:32 PM at epicenter
Time of Earthquake in other Time Zones
Location
35.943°S, 101.487°W
Depth
9.9 km (6.2 miles)
Region
SOUTHEAST OF EASTER ISLAND
Distances
1232 km (765 miles) SE of Hanga Roa, Easter Island
2083 km (1294 miles) WSW of San Juan Bautista, Juan Fernandez Is.
2481 km (1541 miles) W of Lebu, Bio-Bio, Chile
2824 km (1754 miles) WSW of SANTIAGO, Region Metropolitana, Chile
Location Uncertainty
horizontal +/- 28 km (17.4 miles); depth +/- 2.1 km (1.3 miles)
Parameters
NST=132, Nph=134, Dmin=>999 km, Rmss=0.51 sec, Gp=187°,
M-type=body wave magnitude (Mb), Version=8
Source
Magnitude: USGS NEIC (WDCS-D)
Location: USGS NEIC (WDCS-D)
Event ID
usc0008spq
Did you feel it? Report shaking and damage at your location. You can also view a map displaying accumulated data from your report and others.
Can I ask one of you shaker buffs if there has been a noticeable increase in the number of quakes around the UK?
I look on the British Geological Survey site from time to time and it shows the number of quakes over the last 50 days detailed on a map of the UK. It's lit up light a xmas tree at the moment, all very minor quakes but I've not seen it so busy.
The site doesn't seem to be working very well at the moment and I can't pull up any data to verify this.
reply to post by JonoEnglish
Not sure what you mean by pull up any data to verify?
The BGS site seems to be working OK as far as I can see now anyway.
Indeed it is marginally busier than normal on account of the wee swarm that is going on around Islay and down as far as Buncrana, but really as you observe nothing to be getting excited about.
Just felt this one, heard it coming, ground felt "unstable" then rock and roll
Geonet Rapid data up as fast as it took me to open the page, 1 minute 46 seconds
beta.geonet.org.nz...
revised to 12km deep now
IRIS SNZO BHZ graph
Geonet Rapid data up as fast as it took me to open the page, 1 minute 46 seconds
Public Id: 2012p242656
NZDT: Saturday, March 31 2012 at 7:47:37 am
Intensity: strong
Depth: 24 km
Magnitude: 4.7
Location: 20 km east of Martinborough
Status: automatic
beta.geonet.org.nz...
edit on 30-3-2012 by muzzy because: (no reason given)
revised to 12km deep now
edit on 30-3-2012 by muzzy because: (no reason given)
IRIS SNZO BHZ graph
edit on 30-3-2012 by
muzzy because: (no reason given)
Originally posted by PuterMan
reply to post by JonoEnglish
Not sure what you mean by pull up any data to verify?
The BGS site seems to be working OK as far as I can see now anyway.
Indeed it is marginally busier than normal on account of the wee swarm that is going on around Islay and down as far as Buncrana, but really as you observe nothing to be getting excited about.
He thanks for the reply.
I was unable to get the data prior to 50 days to check whether it was an increase in activity (even though very minor), every link didn't and still doesn't work for me. I'm not sure why, I know I'm having problems with my internet with some sites loading, whilst others refuse point blank to do anything. I know about as much about computers than earthquakes, as in I know they are there but beyond that *sigh*
I don't frequently look at the BGS site but occasionally take a peak now and then and noticed what I believed to be an increase in activity. With what 'seemed like' an increase on seeing or hearing stories on gas explosions and then the gas leak from the rig in the North sea, I was wondering if things were indeed heating up in that area.
I'm not implying any correlation or connection to those events, it just seemed odd seeing the increase.
Again, thanks for the reply.
edit on 30-3-2012 by JonoEnglish because: (no reason given)
new topics
-
Bizarre Labour Party Tic Toc Video Becomes Even More Embarrassing
Regional Politics: 4 hours ago -
Potter to WHU
World Sports: 10 hours ago
top topics
-
The elephant in the room (wearing a hoodie)
US Political Madness: 12 hours ago, 14 flags -
Dr. Demento
Music: 12 hours ago, 6 flags -
Bizarre Labour Party Tic Toc Video Becomes Even More Embarrassing
Regional Politics: 4 hours ago, 4 flags -
Potter to WHU
World Sports: 10 hours ago, 2 flags
active topics
-
Los Angeles brush fires latest: 2 blazes threaten structures, prompt evacuations
Mainstream News • 259 • : marg6043 -
The Acronym Game .. Pt.4
General Chit Chat • 1039 • : JJproductions -
What Is 'Quad Demic'? Mask Mandate Returns In These US States
Diseases and Pandemics • 43 • : DeadlyStaringFrog -
To become president, Zelensky had to learn Ukrainian
Political Conspiracies • 32 • : firerescue -
The elephant in the room (wearing a hoodie)
US Political Madness • 23 • : fringeofthefringe -
President Carter has passed
Mainstream News • 56 • : angelchemuel -
Remember These Attacks When President Trump 2.0 Retribution-Justice Commences.
2024 Elections • 141 • : bluesman023 -
Post A Funny (T&C Friendly) Pic Part IV: The LOL awakens!
General Chit Chat • 8009 • : Cymru -
Bizarre Labour Party Tic Toc Video Becomes Even More Embarrassing
Regional Politics • 8 • : gortex -
What Comes After January 20th
Mainstream News • 39 • : DontTreadOnMe
