It looks like you're using an Ad Blocker.
Please white-list or disable AboveTopSecret.com in your ad-blocking tool.
Thank you.
Some features of ATS will be disabled while you continue to use an ad-blocker.
share:
reply to post by Justinarng
Hi Justinarng
Welcome to ATS and in particular to Quake Watch.
Here you will find some of the best information about earthquakes on the Internet. Why do I say that? Because the members who frequent this thread, and those who lurk and occasionally stick their heads up into the firing line on the whole produce excellent work that is based on facts.
You will find some of the alternative geophysical theories on this thread: Geophysics which is hosted by Zenius who you will also see on this thread.
Anything of a speculative nature to do with Yellowstone / Fracking / Arkansas / Bird Deaths / Hudson Bay / Life / Death / Resurrection / the Economy / Politics / Religion etc you can post on the thread hosted by Robin Marks/Eric Blair: Robinesque Ruminations
Volcano stuff you will find on Volcano Watch and last but by no means least the giant Yellowstone thread is a BIG read all about the Park that has passed page 700.
These and more ATS links, and links to many external sites you can find in my signature block and in the signatures of others.
Never be afraid to ask a question. We will always try to answer, and no one gets ridiculed here because of a lack of knowledge on what is a complex and multifaceted subject. (Well not if the question is reasonable at least!)
With regard to the quake in Wyoming that was deleted. I have it in my list of deleted quakes.
The most likely reason is that this a teleseism incorrectly identified by the computer system as a local quake, or alternatively it could be a Gillette mining blast. It did happen, and you can see it on this seismogram BW06.US.00.BHZ.2012.082 - it is the green squiggle at the bottom. You can also see it slightly better on this one: RWWY.IW..BHZ.2012.082
This is the trace from the one immediately above as displayed in Vase

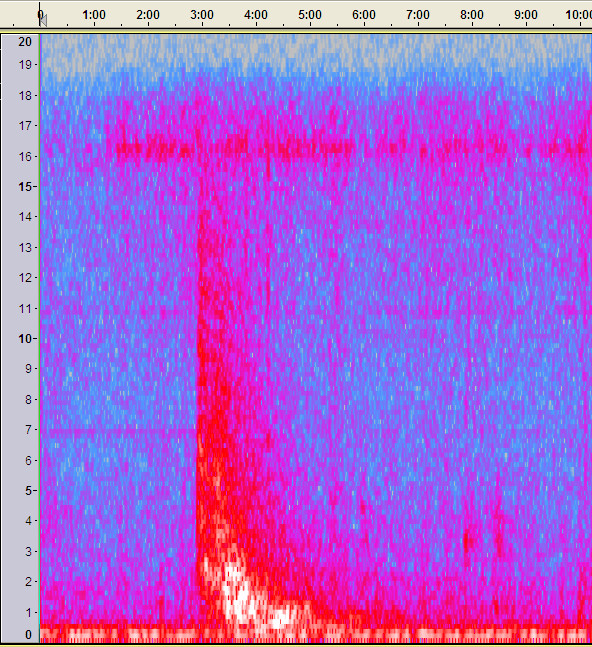
This is the spectrum of that and my conclusion from that would be mine blast.
Hi Justinarng
Welcome to ATS and in particular to Quake Watch.
Here you will find some of the best information about earthquakes on the Internet. Why do I say that? Because the members who frequent this thread, and those who lurk and occasionally stick their heads up into the firing line on the whole produce excellent work that is based on facts.
You will find some of the alternative geophysical theories on this thread: Geophysics which is hosted by Zenius who you will also see on this thread.
Anything of a speculative nature to do with Yellowstone / Fracking / Arkansas / Bird Deaths / Hudson Bay / Life / Death / Resurrection / the Economy / Politics / Religion etc you can post on the thread hosted by Robin Marks/Eric Blair: Robinesque Ruminations
Volcano stuff you will find on Volcano Watch and last but by no means least the giant Yellowstone thread is a BIG read all about the Park that has passed page 700.
These and more ATS links, and links to many external sites you can find in my signature block and in the signatures of others.
Never be afraid to ask a question. We will always try to answer, and no one gets ridiculed here because of a lack of knowledge on what is a complex and multifaceted subject. (Well not if the question is reasonable at least!)
With regard to the quake in Wyoming that was deleted. I have it in my list of deleted quakes.
Date/Time UTC,Latitude,Longitude,Magnitude,Depth(Km),Location
2012-03-22 21:52:26, 41.637, -108.927, 3.1, 0.5, Wyoming
The most likely reason is that this a teleseism incorrectly identified by the computer system as a local quake, or alternatively it could be a Gillette mining blast. It did happen, and you can see it on this seismogram BW06.US.00.BHZ.2012.082 - it is the green squiggle at the bottom. You can also see it slightly better on this one: RWWY.IW..BHZ.2012.082
This is the trace from the one immediately above as displayed in Vase

This is the spectrum of that and my conclusion from that would be mine blast.

reply to post by bellagirl
One could of course save time looking by reading the post above you.
Do we actually need to post 1 quake several time?
One could of course save time looking by reading the post above you.
Do we actually need to post 1 quake several time?
hello puterman.
with regards to this quake in south australia, for a 5.6 would you be expecting to see aftershocks within the first hour?
with regards to this quake in south australia, for a 5.6 would you be expecting to see aftershocks within the first hour?
reply to post by bellagirl
Possibly not as continental quakes like this tend not to have such a defined aftershock sequence depending on the type of fault of course I should add.
But then again, if it is on the lines......
Possibly not as continental quakes like this tend not to have such a defined aftershock sequence depending on the type of fault of course I should add.
But then again, if it is on the lines......
edit on 23/3/2012 by PuterMan because: (no reason given)
reply to post by PuterMan
forgive us if we get a little excited over here when we have a 5.6
when you wait over 20 years between drinks, you tend to think its a big thing!
forgive us if we get a little excited over here when we have a 5.6
when you wait over 20 years between drinks, you tend to think its a big thing!
reply to post by bellagirl
5.6 is significant for Australia. I never said otherwise. If it was not I would not have bothered to post it.
Source
Only 20 years - ???
Here you go - Australia from the Centennial and ANSS catalogue 1900 to 2011
Most of those are actually not on land but off the coast.
Here is a 6.8 on land - about 114 km from Perth.
5.6 is significant for Australia. I never said otherwise. If it was not I would not have bothered to post it.
Earthquakes that occur on land far from the boundaries of tectonic plates may actually be aftershocks of large quakes centuries ago, a new report suggests.
Source
Only 20 years - ???
Here you go - Australia from the Centennial and ANSS catalogue 1900 to 2011
DateTimeAsString, Latitude, Longitude, Magnitude, Depth
1906-11-19T07:18:18.000Z,-22,109,7.2,0
1910-07-07T08:17:00.000Z,-12,108,6.8,0
1921-09-11T04:01:25.970Z,-13.095,110.177,7.3,25
1941-04-29T01:35:40.290Z,-26.791,116.197,6.8,25
1957-06-18T17:56:11.980Z,-25.597,170.075,6.7,30
1966-10-12T00:06:37.990Z,-12.005,121.681,5.7,19
1967-03-30T02:08:01.080Z,-11.142,115.309,6,11.5
1968-10-14T02:58:50.850Z,-31.523,116.978,6.8,5
1970-03-10T17:15:12.110Z,-31.093,116.513,5.5,15
1970-03-24T10:35:20.610Z,-22.058,126.673,5.9,15
1972-08-28T02:18:56.130Z,-24.991,136.326,5.6,13.4
1979-04-23T05:45:11.270Z,-16.62,120.166,6.2,31.6
1979-06-02T09:47:59.750Z,-30.784,117.132,6.1,3
1979-07-24T19:31:18.230Z,-11.185,107.628,7,12.1
1982-05-20T22:55:56.700Z,-27.863,172.334,5.8,25.9
1982-08-07T20:56:22.660Z,-11.233,115.305,6.5,24.3
1983-11-25T19:56:10.350Z,-40.514,155.544,6,26.1
1986-01-02T21:33:44.180Z,-34.484,112.098,5.5,11.8
1986-03-30T08:53:53.780Z,-26.288,132.701,5.7,5
1988-01-22T00:35:59.750Z,-19.874,133.778,6.3,5
1988-01-22T03:57:26.530Z,-19.875,133.83,6.4,3
1988-01-22T12:04:59.220Z,-19.897,133.828,6.6,5
1988-01-29T10:19:34.880Z,-19.892,133.834,5.5,15
1997-08-10T09:20:34.150Z,-16.128,124.346,6.2,20
2001-09-14T15:18:28.770Z,-19.867,133.79,5,10
2001-09-20T02:01:51.820Z,-11.375,115.042,5.6,10
2001-09-20T02:01:53.060Z,-11.387,115.004,5.6,9.3
2001-09-28T02:54:54.270Z,-30.475,117.382,5.1,10
2001-10-19T17:43:20.100Z,-33.708,120.669,5,10
2002-03-05T01:47:38.040Z,-30.52,117.18,5,10
2002-04-21T17:58:46.970Z,-20.521,162.185,5.7,33
2002-07-15T19:16:07.770Z,-11.337,115.262,5.1,33
2004-02-11T09:17:58.000Z,-22.738,129.871,5,13
2004-12-07T04:37:52.500Z,-20.018,156.74,5,28.9
2006-05-13T01:04:46.000Z,-27.719,135.992,5.1,1
2006-12-26T07:29:01.490Z,-38.221,112.029,5.2,10
2007-02-15T15:38:36.000Z,-25.967,113.276,5.3,19
2009-03-06T01:35:57.710Z,-16.167,121.299,5.1,10
2009-08-05T21:43:26.190Z,-38.844,137.239,5,10
2010-02-24T11:57:58.080Z,-30.228,165.862,5.4,10
2010-04-20T00:17:08.000Z,-30.794,121.406,5.2,0
2010-07-24T19:17:56.000Z,-12.548,114.522,5,10
2011-04-16T05:31:18.000Z,-20.085,147.764,5,7
2011-04-17T18:41:18.460Z,-19.921,113.73,5.3,10
2011-12-05T19:10:00.000Z,-21.51,114.42,5.1,15
Most of those are actually not on land but off the coast.
Here is a 6.8 on land - about 114 km from Perth.
1968-10-14T02:58:50.850Z,-31.523,116.978,6.8,5
edit on 23/3/2012 by PuterMan because: (no reason given)
reply to post by bellagirl
Actually you may find this one quite interesting
This is a circular search based on 200 km radius from the location of the 5.6
That location did produce a 6.3 in 1986.
Actually you may find this one quite interesting
This is a circular search based on 200 km radius from the location of the 5.6
That location did produce a 6.3 in 1986.
reply to post by diamondsmith
This one was an expected one by me
with an accelerated process due to multiple causes.
with an accelerated process due to multiple causes.
source(www.antarctica.org.nz...
Movement of the tectonic plates over geological time (continental drift) has resulted in the continuous restructuring of the earth’s surface. Part of the drift process resulted in the splitting up of the ancient Gondwana supercontinent. The process began about 178 million years ago (early Jurassic) with the splitting of Antarctica from Africa, and ended about 96 million years ago (late Cretaceous) with the separation of Australia and New Zealand from Antarctica. Temperatures began to fall significantly around 35 million years ago as the continent drifted away from South America and Australasia. Bradshaw (1990) provides an excellent reference source for the early geologic history of Antarctica.
source(globalwarmingisreal.com...
According to research published this week in the journal Nature Geoscience, scientists from the Lamont-Doherty Earth Observatory at Columbia University have recorded ocean currents driving at and underneath the ice shelf, carving out an expanding cavity from underneath the glacier, creating a growing impact 50 percent greater than when scientists began monitoring the region in the early 1990′s. Researchers estimate that 2.5 miles of glacier now slide into the sea annually. In a summary report, scientists say the rapid rate of deterioration of the Pine Island Glacier could significantly impact coastlines around the globe: Source: Global Warming is Real (s.tt...)
thanks for the info. as you can see that quake was 1968. like i said its usually a long time between drinks for us here on the mainland for this
magnitude. larger quakes in the top end near indonesia are sometimes reported as the "australian region". to us...different country...different
region
After the 7.4 quake in Mexico there have been 117 mini quakes or replicas.
Sismologico Mexico
They say that the quakes are related but we have new quakes coming from guerrero and not oaxaca where the 7.4 quake appear.
Sismologico Mexico
They say that the quakes are related but we have new quakes coming from guerrero and not oaxaca where the 7.4 quake appear.
edit on 23-3-2012
by lke123 because: (no reason given)
Originally posted by lke123
After the 7.4 quake in Mexico there have been 117 mini quakes or replicas.
Sismologico Mexico
Twitter doesn't allow direct links to their pages, you have to be signed in (a twit?) to see it I guess.
mini quakes or replicas must be a bad translation of aftershocks, as when I downloaded the data for my Oaxaca timeline graph 10 hours ago there were 91 aftershocks.
Its not many compared to some others for the first 63 hours as mentioned in the post I did
Did you read it?
You seem concerned about Guerrero, what do base this fear on? historic data does not support triggering of other very strong quakes in Mexico.
reply to post by muzzy
5.3 Mw from Geofon
geofon.gfz-potsdam.de...
I hate all these different scales!!
5.3 Mw from Geofon
geofon.gfz-potsdam.de...
I hate all these different scales!!
Originally posted by PuterMan
reply to post by muzzy
5.3 Mw from Geofon
geofon.gfz-potsdam.de...
I hate all these different scales!!
ML is all we have from GeoAu at the moment.
If you download the data (bottom left hand corner) and click all the boxes you will get the various mag types on the csv file (but you probably knew that)
there is none to compare with on there with a high ML, maybe later they will put up their mb or Mw
geez shallow at 3km, I didn't notice that previously.
Possible old mine collapse, as happened at Newcastle 1968?
Hey all, what do you make of this?

Station TA.C36A.BHZ @approximately 17:09 UTC.
I was watching a few stations around Clintonville,Wisconson when I noticed this activity in Angora, MN. It shows on at least 15 stations from TA.B33A farther north and west, all the way down to TA.F39A in Loretta, WI. I don't see anything on USGS yet--possibly because it is from blasting?
Here is station TA.C35A.BHZ from Iris:
If you scroll down this page, you can see all of the temporary array sites that it registered on:
What do you think? Any chance this is related to the "mystery booms and rattling"? It seems too far away IMHO.
edit on 3/23/2012 by Olivine
because: spelling errors
Originally posted by muzzy
Originally posted by PuterMan
reply to post by muzzy
5.3 Mw from Geofon
geofon.gfz-potsdam.de...
I hate all these different scales!!
ML is all we have from GeoAu at the moment.
If you download the data (bottomlefthand corner) and click all the boxes you will get the various mag types on the csv file (but you probably knew that)
there is none to compare with on there with a high ML, maybe later they will put up their mb or Mw
geez shallow at 3km, I didn't notice that previously.
Possible old mine collapse, as happened at Newcastle 1968?
should have read "bottom right hand corner"
for those who want to follow GeoAu, you acn also click on the "add/remove feilds" button and tick the boxes there. It will reset the page and show the Mb, ML, Ms, Mw on the list if it is available. Looks like it stores a cookie on your computer so it works all the time (until you delete cookies of course)
www.ga.gov.au...#
Interesting fact: There are on average 200 earthquakes of magnitude 3.0 or more in Australia each year. Earthquakes above magnitude 5.5, such as the 5.6 magnitude event in Newcastle in 1989, occur on average every two years. About every five years there is a potentially disastrous earthquake of magnitude 6.0 or more.
Recently 30km to the west there was this;
13-Mar-2005 02:09:49
Lat -26.155, Long131.644
Mag 4.6
West of Ernabella,SA
A Decade of Earthquakes 2000-2009
edit on 23-3-2012 by muzzy because: (no reason
given)
reply to post by PuterMan
Thanks Puterman, Like I said I have been following this thread since Quake watch 2011 and I appreciate and respect your view/opinions. I apologize if the Yellowstone thing is getting old, just saw 3.1 and thought that might be a significant magnitude given the location. I will def follow up with the Yellowstone thread, thx for the direction! Keep up the good work everybody, and thx for not totally thrashin the new guy!
Thanks Puterman, Like I said I have been following this thread since Quake watch 2011 and I appreciate and respect your view/opinions. I apologize if the Yellowstone thing is getting old, just saw 3.1 and thought that might be a significant magnitude given the location. I will def follow up with the Yellowstone thread, thx for the direction! Keep up the good work everybody, and thx for not totally thrashin the new guy!
reply to post by Olivine
Mm. Never seem a spectrogram looking like this before. All in the ~15Hz bracket. Not earthquakes that is certain. Explosions/Blasting? No I don't believe so.
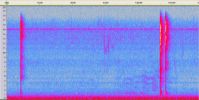
I have downloaded about 20 the the stations around. I will see if I can get a better idea and maybe pinpoint the location.
Mm. Never seem a spectrogram looking like this before. All in the ~15Hz bracket. Not earthquakes that is certain. Explosions/Blasting? No I don't believe so.

I have downloaded about 20 the the stations around. I will see if I can get a better idea and maybe pinpoint the location.
reply to post by Olivine
Olivine, how long timewise do you think that signal is on your trace? I am making these around 1 minute 40 seconds long but they don't sound like mine blasts.
What ever it is it starts suddenly and then fades away over around 1m 26s on the first and second of the double. In fact it looks as if the second is an exact copy of the first but just very slightly less amplitude. I am wondering if these are sonic booms. Here is a (very poor) trace from a sonic boom.
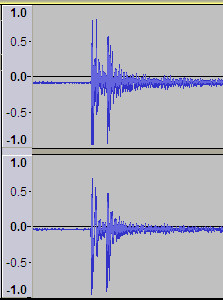
and here is the trace off the seismo.
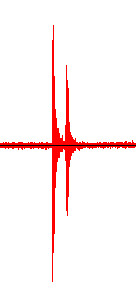
I need to find a better sonic boom but this is my initial thoughts.
Have a listen @ 10x speed TA_C36A_BHZ_20120323_800sps.wav
Olivine, how long timewise do you think that signal is on your trace? I am making these around 1 minute 40 seconds long but they don't sound like mine blasts.
What ever it is it starts suddenly and then fades away over around 1m 26s on the first and second of the double. In fact it looks as if the second is an exact copy of the first but just very slightly less amplitude. I am wondering if these are sonic booms. Here is a (very poor) trace from a sonic boom.

and here is the trace off the seismo.

I need to find a better sonic boom but this is my initial thoughts.
Have a listen @ 10x speed TA_C36A_BHZ_20120323_800sps.wav
72 hour Aftershock Timeline Graph ( magnitude versus time) for the Oaxaca, Mexico 7.4Mw, 20/03/2012 earthquake based on data from the El Servicio
Sismológico Nacional, Mexico
Just under 2,000,000 Tonnes of TNT energy released
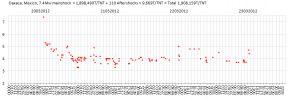
I've created a page over at World 7+ Project to put them all on for comparison called 72HourAftershockTimelinGraphs
I was having a read of what earthquake-report.com/guerreo/oaxaca had to say and read these witness reports from Mexico City.
Reports there that 2 people have died, one crushed by a wall and another had a heart attack during the quake
Just under 2,000,000 Tonnes of TNT energy released

I've created a page over at World 7+ Project to put them all on for comparison called 72HourAftershockTimelinGraphs
I was having a read of what earthquake-report.com/guerreo/oaxaca had to say and read these witness reports from Mexico City.
"I live on the 24th floor of a bulding in this area. The quake began slowly but began to be stronger and stronger, books and objets from shleves began to fly around. It was so intense that it was impossible to stand up. A frightening experience!"
"It honestly felt like my eyes were going cross-eyed i couldnt even see straight the whole house was moving. Scary things"
"3rd floor of some sturdy 5-floor buildings that survived the last big one. I often don't even notice weaker quakes, but this one had very noticeable shaking, which even made me dizzy, and lasted 20-30 seconds"
Reports there that 2 people have died, one crushed by a wall and another had a heart attack during the quake
new topics
-
Bizarre Labour Party Tic Toc Video Becomes Even More Embarrassing
Regional Politics: 4 hours ago -
Potter to WHU
World Sports: 10 hours ago -
Dr. Demento
Music: 11 hours ago -
The elephant in the room (wearing a hoodie)
US Political Madness: 11 hours ago
top topics
-
The elephant in the room (wearing a hoodie)
US Political Madness: 11 hours ago, 14 flags -
Dr. Demento
Music: 11 hours ago, 6 flags -
Bizarre Labour Party Tic Toc Video Becomes Even More Embarrassing
Regional Politics: 4 hours ago, 4 flags -
Potter to WHU
World Sports: 10 hours ago, 2 flags
active topics
-
Los Angeles brush fires latest: 2 blazes threaten structures, prompt evacuations
Mainstream News • 259 • : marg6043 -
The Acronym Game .. Pt.4
General Chit Chat • 1039 • : JJproductions -
What Is 'Quad Demic'? Mask Mandate Returns In These US States
Diseases and Pandemics • 43 • : DeadlyStaringFrog -
To become president, Zelensky had to learn Ukrainian
Political Conspiracies • 32 • : firerescue -
The elephant in the room (wearing a hoodie)
US Political Madness • 23 • : fringeofthefringe -
President Carter has passed
Mainstream News • 56 • : angelchemuel -
Remember These Attacks When President Trump 2.0 Retribution-Justice Commences.
2024 Elections • 141 • : bluesman023 -
Post A Funny (T&C Friendly) Pic Part IV: The LOL awakens!
General Chit Chat • 8009 • : Cymru -
Bizarre Labour Party Tic Toc Video Becomes Even More Embarrassing
Regional Politics • 8 • : gortex -
What Comes After January 20th
Mainstream News • 39 • : DontTreadOnMe
