It looks like you're using an Ad Blocker.
Please white-list or disable AboveTopSecret.com in your ad-blocking tool.
Thank you.
Some features of ATS will be disabled while you continue to use an ad-blocker.
share:
reply to post by pheonix358
He he, Putersman's SS Magnitude scale is really catching on. Too funny!
Oh yeah, the details---hummm, looks like it was upgraded to a JCOB.2:
Source
Sheesh, that is too close to the diachi horror show--at least it wasn't very big or shallow.
He he, Putersman's SS Magnitude scale is really catching on. Too funny!
Oh yeah, the details---hummm, looks like it was upgraded to a JCOB.2:
5.2 26km E of Iwaki, Japan 2012-12-29 23:05:26 37.056°N 141.182°E 58.3
edit on 12/29/2012 by Olivine because: (no reason given)
Source
Sheesh, that is too close to the diachi horror show--at least it wasn't very big or shallow.
edit on 12/29/2012 by Olivine because: add source
of external text
reply to post by Olivine
It was only 30Km from the Nuclear Reactors. Probably far enough and low enough not to cause the Event that would be rMAO. (r=Ripping)
P
It was only 30Km from the Nuclear Reactors. Probably far enough and low enough not to cause the Event that would be rMAO. (r=Ripping)
P
edit on 29/12/2012 by pheonix358 because: (no reason given)
Originally posted by Olivine
reply to post by westcoast
Hi Westcoast. Looking at this USGS map, all but one of these quakes was on/near the San Gregorio fault, which runs parallel to the San Andreas.
This USGS webpage gives more information about the percentages on the Bay Area map I linked above. But from what I can discern, The San Gregario has a 10% chance of generating a Mag 6.7 during the 30 years between 2002-2032.
Thanks....I know, looking at the map that they seem in between the two..being a bit closer to the San Gregorio fault. It's pretty tight though...and most of the quakes I believe are still on their first version, so the location could change (i think). Hope it is, vs the San Andreas!
reply to post by PuterMan
Ms yes I understand this, and P yep,
but the question remains why measure the initial P wave rather than the S wave in the first place?
For a person at the scene, the P wave is just a warning, some initial light shaking and there is a "theres a train coming" type noise, then the S wave hits and everything is going sideways and up and down and stuff is falling over.
I guess thats why the Ms number is always bigger than mb or Mw.
Thats from a point of view of the mag 4+quakes I've felt within 200km of me, which are mostly more than 30km deep.
maybe those 5km deep quakes have a different feel to them?, like the P wave is stonger because there is less rock to get through?, I don't know.
I think your SS scale is pretty cool. but you probably have the panic on too early.
Depending how close and deep it is there is no need to even get off your arse until about mag 6.5mb/7.1ML
Your scale made me think of the 7.1mb/ 8.0Mw/7.9HRV/ 8.3Me we felt on another Sunday afternoon back in May 2006, it was north of Tonga 3000km from us, it felt like the whole country of NZ shifted sideways and back again a couple of times, no shaking or rattling, just a wobble, made you feel dizzy. that quake
"HRV" theres another magnitude type for you to ponder
I see they upgraded that from 7.9Mw since I first put it on the 7+ blog map.
Its that quake that sent me over the edge and I quit watching the weather and got into quakewatching, I had never felt one like that before.
edit on 29-12-2012 by muzzy because: (no reason given)
Originally posted by curiouswa
Japan paper on atmospheric conditions changing
I guess what I'm saying is there a software application that considers these types of data?
Earthquake precursors • Planetary positions • Ground deformations • Geomagnetic methods • Energy accumulation rate • Earthquake clouds • Gravity anomalies • Ground water level • Radon concentrations • Meteorological conditions • Thermal infrared • Infrasound • Crustal stress • Abnormal behaviour of animals • Geo-electric pulse • Historical/statistical data • Ground-based EM field • Tilt meters • GPS • TGFR • MS-Double Time Method • Geo-electricity • Micro-vibration • Earth resistivity • Geochemistry • Seismic gap • Foreshocks • Geodesy • Micro-changes • Ionosphere
I am not personally aware of any software that ties together all of the above - which would be a massive undertaking.
First let me state for the record that I am very interested in pretty much all of the above but there seems to be a few problems.
First, as Joe Public, we do not have access to many of the data sources at a level of technology that would make them of interest, by which I mean for example the TEC maps available to us are really worse than useless. I have been collecting them 24/7 every 5 minutes for over a year now (100,000+ images) and I can detect nothing by way of a precursor from that source. This may be because we just have the 'public' variety, I don't know. I have thought on occasion that i could see something but it turned out to be nothing. And that itself leads on to the second problem
There is a body of research out there linking these types of data to events after the occurrence. Generally they link to a few events. No one has demonstrated that for example every Mag 5 and above exhibits these precursors which would means there was a workable demonstrable system. Unfortunately, and in many ways very regrettably, most of this appears to be straw clutching cherry picking.
If these precursors were consistent, and I do believe there are consistent precursors to be discovered, then the system would after this length of time be operational even if only as an experimental one. This has been mooted for well over a decade now. Yet with all the kit described in that PDF you linked we still have no experimental warning system and people are still losing their lives to earthquakes.
reply to post by AuntC
I guess it depends what you call normal really. The incidence of quakes marked as San Francisco Bay in the name, shows a reasonably steady pattern over the year with a peak in July and another smaller one around Feb/Mar. This current peak would appear to be no more significant than either of those. Indeed it transpires that Feb/Mar was the larger of the two increases.
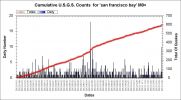
Looking at the energy the Feb/Mar time was more significant than July which appears to have been a numeric increase and the December events show little increase in total energy.
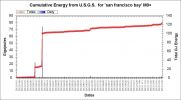
The Feb March energy was boosted by the only Mag 3+ events in the year
Overall my impression would be that this is nothing particularly out of the ordinary for the area.
Its not a normal thing in that area
I guess it depends what you call normal really. The incidence of quakes marked as San Francisco Bay in the name, shows a reasonably steady pattern over the year with a peak in July and another smaller one around Feb/Mar. This current peak would appear to be no more significant than either of those. Indeed it transpires that Feb/Mar was the larger of the two increases.

Looking at the energy the Feb/Mar time was more significant than July which appears to have been a numeric increase and the December events show little increase in total energy.

The Feb March energy was boosted by the only Mag 3+ events in the year
Prov,Date/Time UTC,Latitude,Longitude,Magnitude,Depth(Km),Location
usgs,2012-03-05 13:33:20, 37.926, -122.310, 4.0, 8.1, San Francisco Bay Area. California
usgs,2012-03-05 13:33:12, 37.927, -122.303, 3.5, 8.3, San Francisco Bay Area. California
usgs,2012-02-16 17:13:20, 38.078, -122.234, 3.5, 8.3, San Francisco Bay Area. California
usgs,2012-02-16 02:09:14, 38.076, -122.232, 3.5, 8.8, San Francisco Bay Area. California
Overall my impression would be that this is nothing particularly out of the ordinary for the area.
reply to post by Olivine
JMA have it as JCOB.1 and Potsdam have JCOB.3 which is getting close to the optional JCOFB which supplements JCOB from JCOB.5 to JCOB.9
The SS earthquake intensity chart
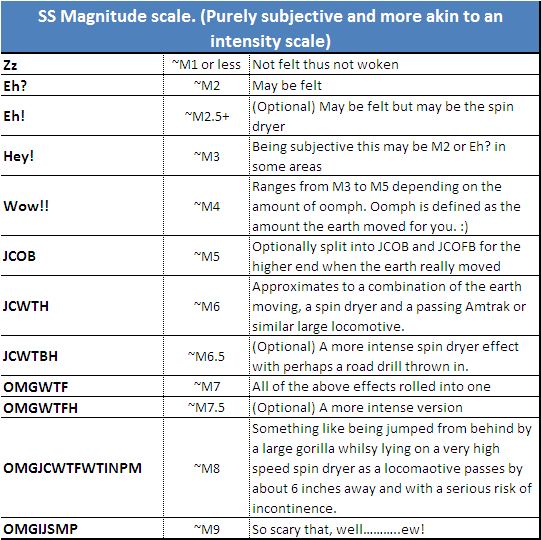
JMA have it as JCOB.1 and Potsdam have JCOB.3 which is getting close to the optional JCOFB which supplements JCOB from JCOB.5 to JCOB.9
The SS earthquake intensity chart

edit on 30/12/2012 by PuterMan because: (no reason given)
reply to post by PuterMan
I'm sorry. I canna work out the last two. Some of these are dependent on Country of Residence. Perhaps break them into their component parts and then use polite speak to describe them. You can't make them needing those there university degrees just so weez can understand them like.
P
I'm sorry. I canna work out the last two. Some of these are dependent on Country of Residence. Perhaps break them into their component parts and then use polite speak to describe them. You can't make them needing those there university degrees just so weez can understand them like.
P
reply to post by pheonix358
If you can work out the others I am not understanding why you cannot work out the last two?
OMGJCWTFWTINPM
OMG - you know what that is - Oh My Goodness is the polite version
JC - politely jeepers creepers
WTF - you know that one I am sure - in Irish what the feck
The following WT merely directs the attention to the earthquake - Was That meaning earthquake.
INPM - a possible reference for this is given in the chart "with a serious risk of incontinence" as in "I nearly peed myself"
The second one - OMGIJSMP - refers to the soiling of undergarments due to severity of the earthquake.
Duh!
Maybe we should just revert to the Richter scale?
If you can work out the others I am not understanding why you cannot work out the last two?
OMGJCWTFWTINPM
OMG - you know what that is - Oh My Goodness is the polite version
JC - politely jeepers creepers
WTF - you know that one I am sure - in Irish what the feck
1. It was originally a slang term used in Ireland to mean either a) "to steal" or b) "to throw".
2. It's also used as a pretty mild swear word in Ireland.
It's used a) to express that you're pissed off or b) to describe somebody who pissed you off.
It's not related to the word 'F**k', and doesn't have any sexual undertones, so is acceptable for polite company.
The following WT merely directs the attention to the earthquake - Was That meaning earthquake.
INPM - a possible reference for this is given in the chart "with a serious risk of incontinence" as in "I nearly peed myself"
The second one - OMGIJSMP - refers to the soiling of undergarments due to severity of the earthquake.
Duh!
Maybe we should just revert to the Richter scale?
reply to post by PuterMan
No, No, now it is clear as pood pants. Thanks.
Much better scale with little confusion. I could do better for the last two.
M8 IFd (I'm F'd)
M9 ID (I'm Dead)
M10 WAD (We're all Dead)
P
No, No, now it is clear as pood pants. Thanks.
Much better scale with little confusion. I could do better for the last two.
M8 IFd (I'm F'd)
M9 ID (I'm Dead)
M10 WAD (We're all Dead)
P
edit on 30/12/2012 by pheonix358 because: (no reason given)
Originally posted by PuterMan
reply to post by AuntC
Its not a normal thing in that area
I guess it depends what you call normal really. The incidence of quakes marked as San Francisco Bay in the name, shows a reasonably steady pattern over the year with a peak in July and another smaller one around Feb/Mar. This current peak would appear to be no more significant than either of those. Indeed it transpires that Feb/Mar was the larger of the two increases.

Looking at the energy the Feb/Mar time was more significant than July which appears to have been a numeric increase and the December events show little increase in total energy.

The Feb March energy was boosted by the only Mag 3+ events in the year
Prov,Date/Time UTC,Latitude,Longitude,Magnitude,Depth(Km),Location
usgs,2012-03-05 13:33:20, 37.926, -122.310, 4.0, 8.1, San Francisco Bay Area. California
usgs,2012-03-05 13:33:12, 37.927, -122.303, 3.5, 8.3, San Francisco Bay Area. California
usgs,2012-02-16 17:13:20, 38.078, -122.234, 3.5, 8.3, San Francisco Bay Area. California
usgs,2012-02-16 02:09:14, 38.076, -122.232, 3.5, 8.8, San Francisco Bay Area. California
Overall my impression would be that this is nothing particularly out of the ordinary for the area.
here is your energy increase in march,
imageshack.us...
i watch the USGS earthquake map often, during this time period I saw quakes pop up then come down later I figured it was to update the reading on mag. sometimes quakes never came back at all even when i remembered much later to check it still no record. They docter the quake data but total energy out put is harder to docter. Data of solar wind direction also is gone after 3/12/12 12:45:24:0 for a lot of hours. they are trying to hide something that is adding an influx of charged particles to the earth from OPPOSITE side then the sun.... when was the japan mega quake?
Same time the opposing solar wind was hitting us also in 2011.
imageshack.us...
reply to post by aurther61287
First let us establish that the planetary KP index is a measure of the electro magnetic interference. If we agree on that then take a look at 2011

If you look at March 2011 there was sudden onset, and there was a magnetic disturbance (I have the fluxgate images somewhere) but the KP index was not particularly high.
Now take a look at 2012
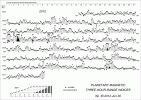
There was no sudden onset on the 5th of March. There was one on the 7th and the 8th and sudden onsets on the 12th and 16th and when the next larger quakes occurred the KP was around 6 but had been higher on the 9th.
As luck would have it just 2 days before that date i started collecting the KP index charts which I have done every day since.
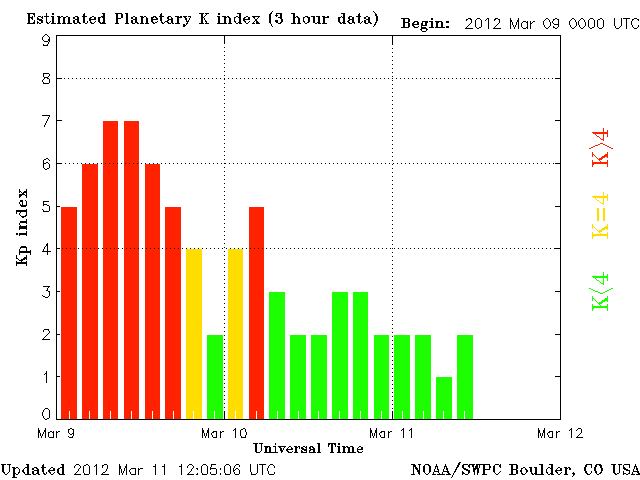
And the image covering the 16th
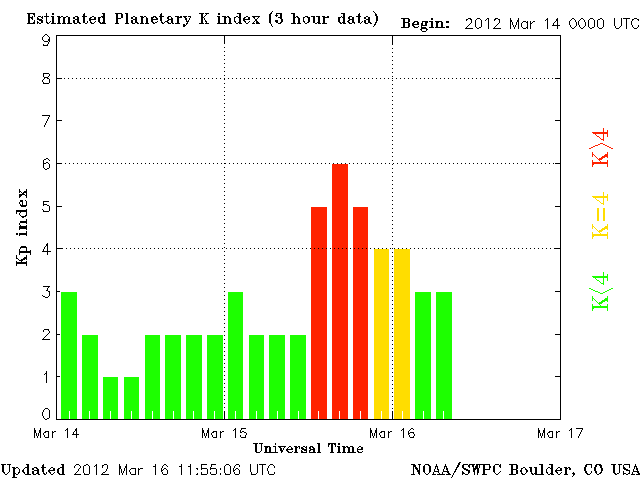
My point is that, whilst I am in agreement with you that the Sun probably does affect earthquakes, most of the correlations between KP and quakes is happenstance.
Why did the massive doses on the 9th not set off the California quake? Because it was too busy setting off the 6.7 in Vanuatu?
The 3rd had no sudden onset and a very low KP, yet there was a Mag 6.6 SE of the Loyalty Islands. The KP on the 5th was 2 - as good as flat - yet there was a 6.1 in Argentina. Despite this lack of correlation do you really consider these minor earthquakes in California were connected to the KP? In that timespan there were 123 other quakes between Mag 3 and Mag 4. Some match the KP and some don't.
Here is the magnetometer for most of that period.
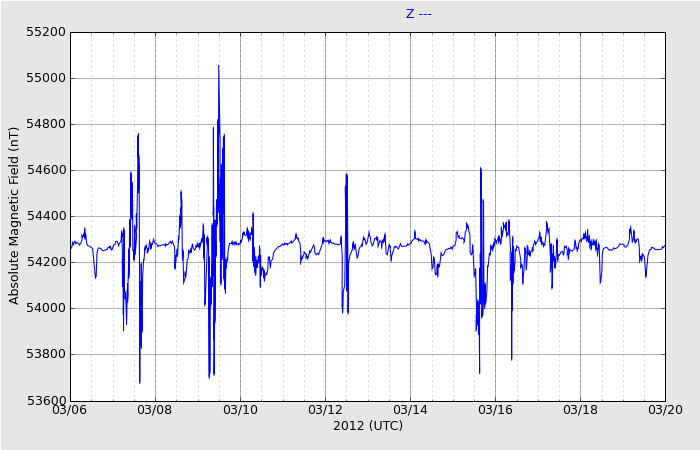
I will leave you with this comment by a man who is a geologist, but not one that follows the dogma religiously.
www.abovetopsecret.com...
Ah, just before I finish I knew I had the correlation between electromagnetic disturbance and the Japanese 9.1
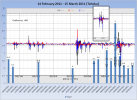
First let us establish that the planetary KP index is a measure of the electro magnetic interference. If we agree on that then take a look at 2011

If you look at March 2011 there was sudden onset, and there was a magnetic disturbance (I have the fluxgate images somewhere) but the KP index was not particularly high.
Now take a look at 2012

There was no sudden onset on the 5th of March. There was one on the 7th and the 8th and sudden onsets on the 12th and 16th and when the next larger quakes occurred the KP was around 6 but had been higher on the 9th.
As luck would have it just 2 days before that date i started collecting the KP index charts which I have done every day since.

And the image covering the 16th

My point is that, whilst I am in agreement with you that the Sun probably does affect earthquakes, most of the correlations between KP and quakes is happenstance.
Why did the massive doses on the 9th not set off the California quake? Because it was too busy setting off the 6.7 in Vanuatu?
The 3rd had no sudden onset and a very low KP, yet there was a Mag 6.6 SE of the Loyalty Islands. The KP on the 5th was 2 - as good as flat - yet there was a 6.1 in Argentina. Despite this lack of correlation do you really consider these minor earthquakes in California were connected to the KP? In that timespan there were 123 other quakes between Mag 3 and Mag 4. Some match the KP and some don't.
Here is the magnetometer for most of that period.

I will leave you with this comment by a man who is a geologist, but not one that follows the dogma religiously.
www.abovetopsecret.com...
Ah, just before I finish I knew I had the correlation between electromagnetic disturbance and the Japanese 9.1

edit on 30/12/2012 by PuterMan because: (no reason given)
Originally posted by Olivine
A little shaking in the Pyrenees.
Shaking in the knees is never good.
Felt reports indicate strong shaking near the epicenter.
Mm. The mind boggles. (Just as a matter of interest would that not normally be the case? I am having a job visualising a quake where the strongest shaking was furthest from the epicentre.)
edit on 12/30/2012 by Olivine because: finishing a sentence
5 years with remission for good behaviour?
edit on 30/12/2012 by PuterMan because: (no
reason given)
reply to post by PuterMan
Sassy pants.
My point, which obviously wasn't obvious, was that some folks characterized the shaking as "V=strong". For only a 'Wow!!.7' either those people are new to the area, or live on soil that intensifies the shake.
There have been 3 'Eh!+' aftershocks.
Sassy pants.
My point, which obviously wasn't obvious, was that some folks characterized the shaking as "V=strong". For only a 'Wow!!.7' either those people are new to the area, or live on soil that intensifies the shake.
There have been 3 'Eh!+' aftershocks.
Originally posted by phoenixlights321
3.9 West of Tofino. Cascadia is not happy! earthquake.usgs.gov...
Cascadia has been quite active recently. I've never seen this much seismic activity in this area before. You should get your earthquake kits ready!!! ASAP!
reply to post by whatup
A I missing something here? It seems quieter than it has been during the year.
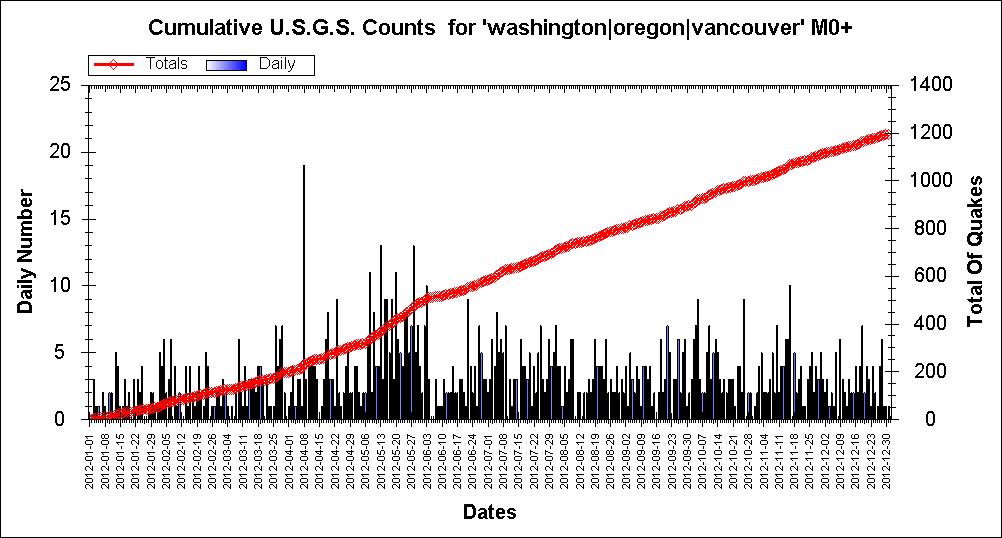
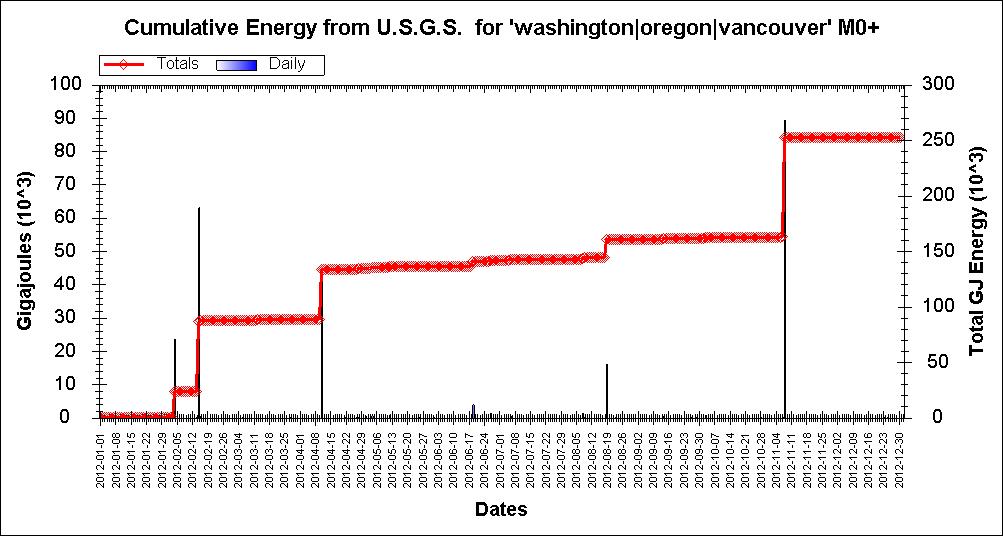
A I missing something here? It seems quieter than it has been during the year.


Originally posted by phoenixlights321
3.9 West of Tofino. Cascadia is not happy! earthquake.usgs.gov...
Cascadia Subduction Zone Tremors Could Foretell Larger Earthquakes, Researchers Explain
The Cascadia subduction zone is capable of producing an earthquake strong enough to make the SoCal "big one" look like a small practice run.
SOURCE
But unlike its western Pacific cousins, the Cascadia subduction zone has not experienced a major earthquake since 1700, when an estimated 9.0-magnitude earthquake generated an enormous tsunami that killed trees in Puget Sound and traveled across the ocean to Japan.
Who knows if they are on the right track?, they have no historic data to compare these small tremors to, so how can they know, ie they don't have any
data prior to 2003, and did these type tremors result in a big quake in the period 2003 to 2012? and did it happen before the 28/10/2012 Queen
Charlotte Islands Island 7.7 ?
It doesn't say
probably a red herring (but "we need more funding to study this")
I'd be more concerned if there were no quakes at all along the plate boundry (ie west of Tofino)
looks OK on SWBC ticking over nicely
It doesn't say
probably a red herring (but "we need more funding to study this")
I'd be more concerned if there were no quakes at all along the plate boundry (ie west of Tofino)
looks OK on SWBC ticking over nicely
edit
on 31-12-2012 by muzzy because: (no reason given)
new topics
-
Australian mercenary caught and crying as he is a prisoner of war.
Other Current Events: 1 hours ago -
JILL BIDEN Wants JOE to Punish Democrats Who Forced Him to Leave Office in Disgrace on 1.20.2025.
2024 Elections: 2 hours ago -
Panamanian President-“every square meter” of the Panama Canal belongs to Panama.
New World Order: 3 hours ago -
NYPD arrests migrant who allegedly set woman on fire on subway train, watched her burn to death
Breaking Alternative News: 5 hours ago -
Chef Gerald R. Ford
Food and Cooking: 8 hours ago -
The clotting is not going away latest
Medical Issues & Conspiracies: 8 hours ago -
F-18 shot down over Red Sea....by our own Destroyer?
Other Current Events: 10 hours ago -
California Business Owners Blindsided by Surprise Payroll Taxes
US Political Madness: 10 hours ago
top topics
-
California Business Owners Blindsided by Surprise Payroll Taxes
US Political Madness: 10 hours ago, 20 flags -
The Effects of Electric Fields and Plasma on Plant Growth
Science & Technology: 16 hours ago, 9 flags -
The clotting is not going away latest
Medical Issues & Conspiracies: 8 hours ago, 9 flags -
F-18 shot down over Red Sea....by our own Destroyer?
Other Current Events: 10 hours ago, 7 flags -
Anti-Government Protest in Serbia
Social Issues and Civil Unrest: 15 hours ago, 6 flags -
NYPD arrests migrant who allegedly set woman on fire on subway train, watched her burn to death
Breaking Alternative News: 5 hours ago, 6 flags -
Panamanian President-“every square meter” of the Panama Canal belongs to Panama.
New World Order: 3 hours ago, 6 flags -
JILL BIDEN Wants JOE to Punish Democrats Who Forced Him to Leave Office in Disgrace on 1.20.2025.
2024 Elections: 2 hours ago, 3 flags -
Chef Gerald R. Ford
Food and Cooking: 8 hours ago, 2 flags -
Australian mercenary caught and crying as he is a prisoner of war.
Other Current Events: 1 hours ago, 2 flags
active topics
-
JILL BIDEN Wants JOE to Punish Democrats Who Forced Him to Leave Office in Disgrace on 1.20.2025.
2024 Elections • 4 • : BernnieJGato -
Panamanian President-“every square meter” of the Panama Canal belongs to Panama.
New World Order • 5 • : FullHeathen -
Just spotted an unusual aircraft Melbourne Australia
Aliens and UFOs • 9 • : Cavemannick -
The Daily Mail trying to imply “it’s aliens”
Dissecting Disinformation • 10 • : Cavemannick -
Australian mercenary caught and crying as he is a prisoner of war.
Other Current Events • 0 • : Cavemannick -
The clotting is not going away latest
Medical Issues & Conspiracies • 10 • : rickymouse -
The Effects of Electric Fields and Plasma on Plant Growth
Science & Technology • 7 • : rickymouse -
F-18 shot down over Red Sea....by our own Destroyer?
Other Current Events • 9 • : berbofthegreen -
Stark Contrast - BIDEN vs TRUMP Interaction With Military GOLD STAR Families.
2024 Elections • 44 • : WeMustCare -
NYPD arrests migrant who allegedly set woman on fire on subway train, watched her burn to death
Breaking Alternative News • 10 • : WeMustCare
