It looks like you're using an Ad Blocker.
Please white-list or disable AboveTopSecret.com in your ad-blocking tool.
Thank you.
Some features of ATS will be disabled while you continue to use an ad-blocker.

Ice cores show faster global warming
page: 12
share:
Ice cores show faster global warming
Ice cores from Greenland and Antarctica show that Earth warmed faster in the 20th century than at any other time in the past 22 millennia, researchers said.
Climatologists from Bern University said their study also showed that concentrations of greenhouse gases are increasing at a faster rate, Swissinfo.com reported. For example, the concentration of carbon dioxide increased by 31 parts per million during one 1,600-year interval in the pre-industrial period -- its fastest growth before the industrial age -- and went up by the same amount in the past 20 years.
More...

22 millennia
This looks like fairly unfavorable evidence to me...
reply to post by loam
I can not get the link to the article to work...
22,000 years, though, does not seem that long a time. I would like more information concerning previous millenia to determine whether other periods experienced similar increases, and decreases of CO2.
I am not a fence-rider in the debate: climate change?- yes. Naturally occuring?- again yes, unless we humans are unnatural.
I have no problem with the link.
Try this one.
I agree 22,000 years is drop in the bucket of earth time, but it's still significant in comparison to how long modern man has been here.
I also agree this still does not resoundingly speak to the issue of causation, but it *IS* more evidence confirming the significant rise in global temperature.
This is one of the more important issues surrounding climate change. If we take the projected temperature increases of 2-4.5'C and applied them over
a few thousand years, the chances are we and the wider biosphere can adapt relatively well.
But a very rapid change, possibly in a hundred years or so? And then more if we don't act soon?
That will have a big impact on how well the biosphere can respond. Never mind the top temps, the rate of change is important.
But a very rapid change, possibly in a hundred years or so? And then more if we don't act soon?
That will have a big impact on how well the biosphere can respond. Never mind the top temps, the rate of change is important.
Thanks to loam for providing a revised link. It worked for me...
another one discussing the past 800 millenia can be found here:www.earthtimes.org...
It may be of the same study.
I am just a bit "ignorant" as to the measurements of CO2 concentraions.
They measure the air bubbles included in the ice ("Tiny Bubbles...") to determine CO2% in an interval in the ice, age must be similar to tree-ring age determinations. However, the measurement of current/ existing CO2 concentrations are taken where...? Is the current measurement an average of many atmospheric collections, or site- specific at the collar of the ice-core drill hole?
The methodology escapes me, and in my ignorance, I have to wonder if the comparisons are being made between apples and oranges.
As in a mineral deposit (a mine) the minerals are not evenly distributed throughout. Numerous sampling sites are required to garner a theoretical average contained in the deposit. The limits may be quite large, regional, or very limited, local. The assay values ( grams/ tonne or %) will vary widely within a specific drill hole, as well as, as within a sample interval of that drill hole. Should you assay the entire sampled length, you will, theoretically, obtain the average value of the mineral being studied. If you select a sample from a point, or interval along the "whole", that sample value will show a higher or lower value than the whole, assuming non-homogeneity along the sample length.
If you could follow that, then you might agree that sampling tiny air bubbles trapped in ice, at specific local sites, can lead to a very diverse values. Even though many sample sites may be utilized, the values obtained are, regardless, site specific.
For each sample: within the time frame of the formation of the ice, what were the prevailing atmospheric conditions? Local rainfall would contribute a higher dissolved CO2%, than would a clear blue sky.
I know the following is a little off topic but you just got me going - I can't help it!!!
RUNAWAY GREENHOUSE
I've studied this in great length at the University of Colorado in Boulder and frankly there's no surprises here. It IS happening. It WILL get faster... and faster.... and faster. What we call a runaway greenhouse effect is already in motion, there is no stopping it. Fully supported by statistical analysis, graphs, charts, etc. This is no "theory" and it's no surprise - it is happening. So when there is breaking news that "another ice chunk broke off" or "the glaciers are half as wide as they should be" or whatever the case may be... do not be surprised by it!
As a short example of the runaway greenhouse effect, which I'm sure people have already talked about on these forums, would be the simple absorption of planet Earth.
For instance, the Earth absorbs so much light per given time period. If there is a reduction in ice then the Earth becomes LESS reflective (ice reflects ;o) and will become DARKER overall, ABSORBING MORE light in the process. Once you start absorbing more light, you start having WARMER temperatures, and even LESS ice will freeze during the winters creating an MORE absorption and LESS reflection each year, and so on... and so on.... this is referred to as a negative feedback loop. It's almost like getting MORE hungry every time you take a bite of food.
Scientists have been warning us about this for over 15 years. When I have more time - I will provide some links to some of my old study materials and you can see for yourselves. I love this topic and am well educated on (or at least I think? ). Curious to see what some other ATS posters thoughts are or if they have studied this. What I will hope to do in the near future is compile the data we currently have AND the rates at which things are changing to give us a forecast model of the future globe. Not sure why this hasn't been done yet - or perhaps it has and I haven't been exposed yet
Originally posted by pyrytyes
I am just a bit "ignorant" as to the measurements of CO2 concentraions.
They measure the air bubbles included in the ice ("Tiny Bubbles...") to determine CO2% in an interval in the ice, age must be similar to tree-ring age determinations. However, the measurement of current/ existing CO2 concentrations are taken where...? Is the current measurement an average of many atmospheric collections, or site- specific at the collar of the ice-core drill hole?
Continuous measures are taken from around the globe for well-mixed areas and are very similar. Historical measures (e.g., ice cores) are taken from wherever they can be obtained.
If you could follow that, then you might agree that sampling tiny air bubbles trapped in ice, at specific local sites, can lead to a very diverse values. Even though many sample sites may be utilized, the values obtained are, regardless, site specific.
They will be site specific, but they generally do show similar results. Although, they must be uncontaminated and well preserved. I'm sure there is one ice core that has given naff data, but majority are comparable.
Siple (Ice-core; Antarctica; CDIAC)
Lawdome (Ice-core; Antarctica; CDIAC)
Mauna Loa (continuous contemporary)
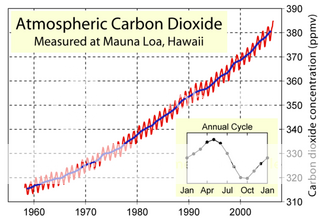
Obviously more difficult to compare due to different time frames etc, but some assessment of how the trends are very similar is illustrated.
For each sample: within the time frame of the formation of the ice, what were the prevailing atmospheric conditions? Local rainfall would contribute a higher dissolved CO2%, than would a clear blue sky.
But the data doesn't really appear to be affected by such things. I'm not sure the resolution is sufficent to be affected by seasonal/weather issues. They tend to assess annual layers separated by oxygen isotope variation. As the Mauna Loa shows, it is an issue for continuous assessment, as CO2 levels do cycle over the year to a degree.
[I'm trying to fix the law dome figure so it's fits the board]
[edit on 4-2-2008 by melatonin]
reply to post by melatonin
Thank you for your informative input. I really appreciate it.
Could you throw out an approximate? number of ice-core holes, or site locations in Antarctica? Mind you, I do not dispute the data, nor intend to...it's just that an idea of the number of sites could help better understand/ correlate the statistics. The number of tiny bubbles counted at each site is not as important as the number (and spacing?) of the various borings.
I am learning. I have a background of Mine Geology, and know that presenting a sales pitch to a group of moneymen to develop an orebody can be quite a challenge when someone asks to see all preliminary data, to include raw assays and sample locations, but then, I've always been ready for that...
(I've heard horror stories...)
Thanks, again. I will endeavor to "catch up to speed"
Originally posted by pyrytyes
Could you throw out an approximate? number of ice-core holes, or site locations in Antarctica? Mind you, I do not dispute the data, nor intend to...it's just that an idea of the number of sites could help better understand/ correlate the statistics. The number of tiny bubbles counted at each site is not as important as the number (and spacing?) of the various borings.
IIRC, there are several sites in antarctica. And, for example, the Law Dome data uses three cores from that particular area. There are others around the globe. Greenland is probably the next most useful, again IIRC, I think it's one of these that gives naff data (due to melt etc). I know they have other cores from more tropical regions (e.g., Andes etc), but I'm not sure they have CO2 data from there - Lonnie Thompson's stuff has definitely been used as temperature proxies.
Thanks, again. I will endeavor to "catch up to speed"
No problem.
new topics
-
“Am I Racist?” - Matt Walsh Explodes DEI Grifters Minds
Movies: 4 hours ago -
Russia labels Saami organizations as terrorists.
Other Current Events: 6 hours ago -
The iceberg that brought down the Titanic was a Russian spy
ATS Skunk Works: 8 hours ago
top topics
-
Kids...
General Chit Chat: 16 hours ago, 11 flags -
“Am I Racist?” - Matt Walsh Explodes DEI Grifters Minds
Movies: 4 hours ago, 11 flags -
Homeward Bound - Yellowstone to Sacramento.
Pets: 14 hours ago, 9 flags -
The iceberg that brought down the Titanic was a Russian spy
ATS Skunk Works: 8 hours ago, 8 flags -
Russia labels Saami organizations as terrorists.
Other Current Events: 6 hours ago, 4 flags
active topics
-
When is art porn and when is it not?
Social Issues and Civil Unrest • 72 • : DontTreadOnMe -
Priests of the Temple of Syrinx
Social Issues and Civil Unrest • 30 • : Solvedit -
Pesto , the Penguin Born to be King
Pets • 11 • : JJproductions -
The iceberg that brought down the Titanic was a Russian spy
ATS Skunk Works • 31 • : chr0naut -
Israel Launches 2nd Wave Of EXPLODING TECH, Hezbollah Radios Begin Exploding
World War Three • 81 • : FlyersFan -
There would be no political madness, if We the People know the Truth
US Political Madness • 43 • : Oxidaddio -
Conservatives and liberals have different brain structures
Political Ideology • 41 • : bastion -
“Am I Racist?” - Matt Walsh Explodes DEI Grifters Minds
Movies • 5 • : chr0naut -
Lue Elizondo Announces New UFO Book "IMMINENT" Coming August 2024
Aliens and UFOs • 145 • : b0kal0ka -
-@TH3WH17ERABB17- -Q- ---TIME TO SHOW THE WORLD--- -Part- --44--
Dissecting Disinformation • 2681 • : Thoughtful3
2