It looks like you're using an Ad Blocker.
Please white-list or disable AboveTopSecret.com in your ad-blocking tool.
Thank you.
Some features of ATS will be disabled while you continue to use an ad-blocker.
0
share:
This is news to me.I just happened by this by chance. Haven't seen it anywhere else. Has anyone seen this scientifically confirmed?
Should go the the video player:
www.msnbc.msn.com...
Should go the the video player:
www.msnbc.msn.com...
I can't get the link to play. But if the report says that 2007 was the warmest on record it would be wrong. It would be wishful thinking on MSN's
part but wrong. 2007 looks to be holding steady around #5 or #6. So pretty flat from last year.
Found the story on MSNBC.
www.msnbc.msn.com...
Not warmest. But 5th warmest. So thats a good thing. Another flat year and evidence that "Global Warming" has ended. That completes 8 or 9 years of flat temperatures. Actually Since 1998 the overall trend is down.
[edit on 12/16/2007 by Indy]
Found the story on MSNBC.
www.msnbc.msn.com...
Not warmest. But 5th warmest. So thats a good thing. Another flat year and evidence that "Global Warming" has ended. That completes 8 or 9 years of flat temperatures. Actually Since 1998 the overall trend is down.
[edit on 12/16/2007 by Indy]
Originally posted by Indy
Actually Since 1998 the overall trend is down.
Why do you keep stating this? It is clearly wrong.


Unless you being ambiguous for the fun of it.
@ IIB: I'm not sure the data has been fully analysed yet, but from what I gather, it was heading to be the warmest on record from the earlier part of the year. However, the latter part did not continue on this path. So, it will be up there in the top several somewhere for sure.
[edit on 16-12-2007 by melatonin]
Originally posted by melatonin
Why do you keep stating this? It is clearly wrong.
Unless you being ambiguous for the fun of it.
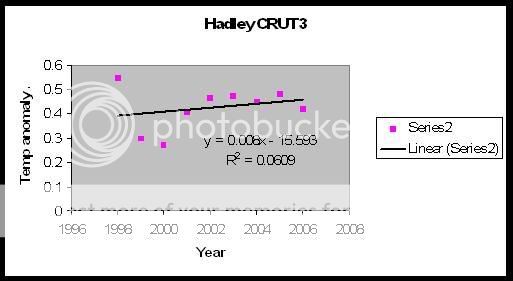
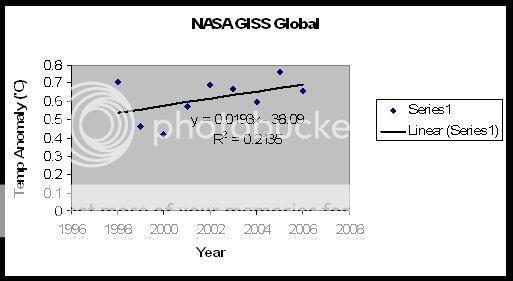
You can draw a cute little line on a graph to connect any two dots you want but the image you post shows the temperatures are flat. And your clever little graph also leaves out the years just prior to 1998 when things were warming up. But as I've stated warming has ended. Erase that line on your graph designed to mislead people and the truth is revealed. 1998 was the warmest and since then temps have been flat. Spin it any way you want. I could have easily picked the 2002 and 2006/2007 dot and indicated a downward slope.
Spin Spin Spin
Indy, you are showing your lack of statistical knowledge here. That line provides a regression analysis of the temperature data, it's not 'connect
any two dots'.
When you say the trend is downwards from 1998, the only way to assess this correctly is using regression statistics. When such stats are used, we still see an upwards trend, it is not 'flat'.
The reason that the data before 1998 has been left out is because the argument is that 'since 1998, the trend is down'. So, to assess this, we use the data from 1998+, this clearly shows the trend is still upwards. The data from before 1998 is irrelevant for your argument.
This is completely ignoring the fact this is just one big cherrypick, using an anomalous point as the starting point in any assessment is bad analysis - and 1998 was anomalous. But even when we do, it still doesn't show what you want it to.
If you want to say that 1998 temps were higher than those after, fair enough, this applies for one set of data (Hadley CRUT), but not the other (NASA-GISS). But you can make no reliable assessment of a trend without some sort of statistics.
With such data, the longer the data series, the more reliable the analysis. Yeah, pick 2002 to 2003; forget that, lets pick august to december; no scrap that, lets do yesterday vs. today...
Yesterday was warmer than today, therefore teh glowb iz kewling!
Even if we find several years of downward trend, it doesn't mean that the science is wrong, we expect noise in the data, we expect natural variability to be present.
[edit on 17-12-2007 by melatonin]
new topics
-
Potter to WHU
World Sports: 54 minutes ago -
Dr. Demento
Music: 2 hours ago -
The elephant in the room (wearing a hoodie)
US Political Madness: 2 hours ago -
To become president, Zelensky had to learn Ukrainian
Political Conspiracies: 9 hours ago
top topics
-
Green Grapes
General Chit Chat: 13 hours ago, 6 flags -
To become president, Zelensky had to learn Ukrainian
Political Conspiracies: 9 hours ago, 6 flags -
The elephant in the room (wearing a hoodie)
US Political Madness: 2 hours ago, 5 flags -
Dr. Demento
Music: 2 hours ago, 2 flags -
Potter to WHU
World Sports: 54 minutes ago, 1 flags
0
