It looks like you're using an Ad Blocker.
Please white-list or disable AboveTopSecret.com in your ad-blocking tool.
Thank you.
Some features of ATS will be disabled while you continue to use an ad-blocker.
8
share:
Key things to know about U.S. election polling in 2024
Im a stats nerd, so research like this is right up my alley. I was listening to a space on X.com talking about polling and one individual brought up a great point now we have so many polling companies even the services that do an aggregate of all the polls accuracy is in question because flawed data is flawed data if we insert a flawed 14-point lead from a NY Times polls into the aggregate when it should be eliminated as an outlier.
Secondly, we have most pollsters using inexpensive opt-in sampling methods. However previous Pew Research Center analyses have demonstrated how surveys that use nonprobability sampling may have errors twice as large, on average, as those that use probability sampling.
Roughly a third of eligible Americans do not vote in presidential elections, despite the enormous attention paid to these contests. Determining who will abstain is difficult because people can’t perfectly predict their future behavior – and because many people feel social pressure to say they’ll vote even if it’s unlikely.
It's why the left still uses the fear-mongering as does Trump who was emphatically imploring the evangelicals to "Get out and voooote!"
Polls are more useful to the public if people have realistic expectations about what surveys can do well – and what they cannot.
Polls are interesting I look at the Polymarket every few days though I don't have one penny "bet" on any outcome. I just find it interesting, Im pretty sure a huge swathe of the people who will vote pay zero attention to Polymarket, 538, 270 to Win, Real Clear Politics, Gallup, and even Pew Research
Last time I checked thier votes count the same as those who are plugged in and follow the polls religiously
www.pewresearch.org...


The need for double margins of error has been confirmed by this independent University of California at Berkley research study. As well as the farther out the polls are from election day the less likely they are accurate
newsroom.haas.berkeley.edu...
Im a stats nerd, so research like this is right up my alley. I was listening to a space on X.com talking about polling and one individual brought up a great point now we have so many polling companies even the services that do an aggregate of all the polls accuracy is in question because flawed data is flawed data if we insert a flawed 14-point lead from a NY Times polls into the aggregate when it should be eliminated as an outlier.
Secondly, we have most pollsters using inexpensive opt-in sampling methods. However previous Pew Research Center analyses have demonstrated how surveys that use nonprobability sampling may have errors twice as large, on average, as those that use probability sampling.
Roughly a third of eligible Americans do not vote in presidential elections, despite the enormous attention paid to these contests. Determining who will abstain is difficult because people can’t perfectly predict their future behavior – and because many people feel social pressure to say they’ll vote even if it’s unlikely.
It's why the left still uses the fear-mongering as does Trump who was emphatically imploring the evangelicals to "Get out and voooote!"
Polls are more useful to the public if people have realistic expectations about what surveys can do well – and what they cannot.
Polls are interesting I look at the Polymarket every few days though I don't have one penny "bet" on any outcome. I just find it interesting, Im pretty sure a huge swathe of the people who will vote pay zero attention to Polymarket, 538, 270 to Win, Real Clear Politics, Gallup, and even Pew Research
Last time I checked thier votes count the same as those who are plugged in and follow the polls religiously
www.pewresearch.org...
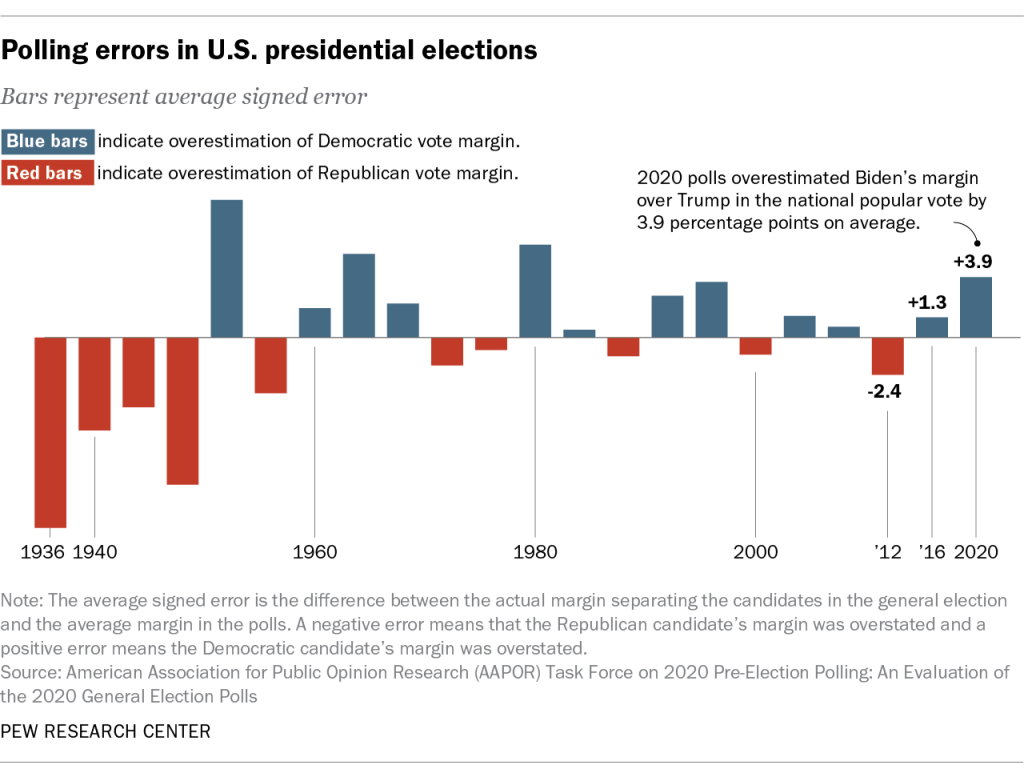
Confidence in U.S. public opinion polling was shaken by errors in 2016 and 2020. In both years’ general elections, many polls underestimated the strength of Republican candidates, including Donald Trump. These errors laid bare some real limitations of polling.
How big were the errors? Polls conducted in the last two weeks before the election suggested that Biden’s margin over Trump was nearly twice as large as it ended up being in the final national vote tally.
Errors of this size make it difficult to be confident about who is leading if the election is closely contested, as many U.S. elections are.
Polls are more useful to the public if people have realistic expectations about what surveys can do well – and what they cannot.
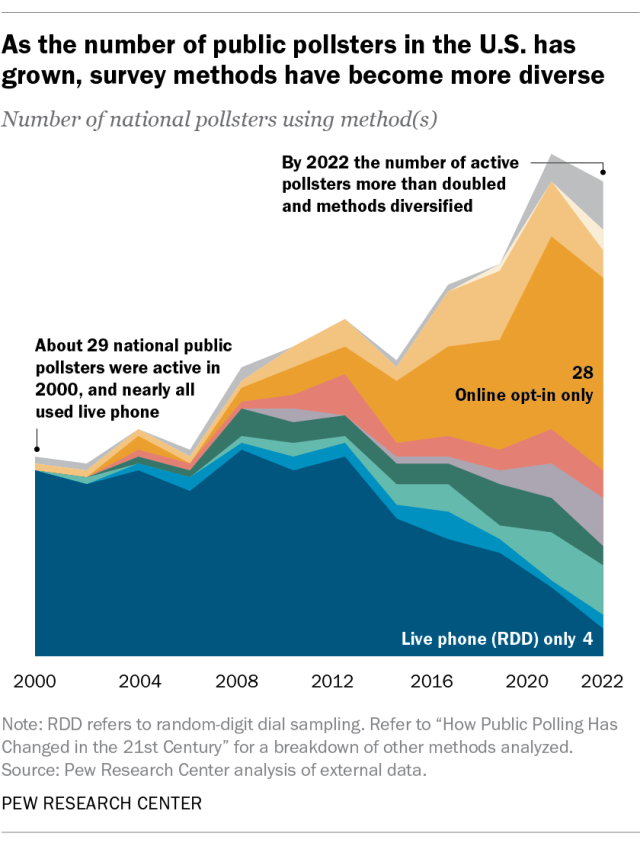
One change is that the number of active polling organizations has grown significantly, indicating that there are fewer barriers to entry into the polling field. The number of organizations that conduct national election polls more than doubled between 2000 and 2022.
Pollsters using inexpensive opt-in sampling methods. But previous Pew Research Center analyses have demonstrated how surveys that use nonprobability sampling may have errors twice as large, on average, as those that use probability sampling.
The second change is that many of the more prominent polling organizations that use probability sampling – including Pew Research Center – have shifted from conducting polls primarily by telephone to using online methods, or some combination of online, mail and telephone. The result is that polling methodologies are far more diverse now than in the past
Roughly a third of eligible Americans do not vote in presidential elections, despite the enormous attention paid to these contests. Determining who will abstain is difficult because people can’t perfectly predict their future behavior – and because many people feel social pressure to say they’ll vote even if it’s unlikely.


The need for double margins of error has been confirmed by this independent University of California at Berkley research study. As well as the farther out the polls are from election day the less likely they are accurate
newsroom.haas.berkeley.edu...
In your paper, you conclude that in order for polls to be 95% accurate just a week before an election, they should double the margin of error they report. Give an example.
Kotak: Let’s say a candidate is polling at 54% a week before the election, with a margin of error of plus-or-minus 3%. The 95% confidence interval implies a 95% chance that the candidate will win 51% to 57% of the vote. Our analysis shows that in reality, you’d have to double that margin of error to plus or minus 6% to get 95% accuracy. That means that the outcome is less certain; the candidate is likely to get anywhere from 48% to 60% of the vote.
Don, as an expert on overconfidence, why do you think the confidence intervals reported by pollsters are so consistently overconfident? Why don’t they increase the margins of error?
Moore: I think poll results are overconfident for many of the same reasons that everyday human judgments are overconfident: We are wrong for reasons that we fail to anticipate. The electorate is changing, and prior elections are imperfect predictors of future elections. When we are wrong about the future and don’t know it, we will make overconfident predictions.
Why do polls include a margin of error and a confidence interval, and what do they tell us?
Aditya Kotak: Both the margin of error and the confidence interval capture “sampling error,” which represents how much the poll’s sample population might differ from the true population of voters. A confidence interval refers to how often the result is expected to fall within the range of the margin of error. It’s important to note, though, that the margin of error only reflects expected imperfections in random sampling, and ignores other sources of error.
You describe sampling error as a “statistical error.” What are some of the non-statistical errors that can make a poll less accurate?
Moore: Sometimes there is bias generated by the method by which pollsters reach respondents. If it’s random-digit dialing, for instance, it will only reach people who have phones and who answer them when pollsters call. If those people are different from those who vote, then the poll’s predictions might be biased.
I just got polled the other night, a girl with a really strong accent was doing the poll. A young kid was screaming she wanted something to eat in
the background and a guy was talking to someone else in the background...sounded like he was doing a poll too.
She was very nice, but a little hard to understand sometimes. Sounded perfectly sober too...I have had some polls done by people who were high or half drunk a few times in the past. I mentioned that I at times had a little problem with her accent, and she appologized for it, and I said I am just not used to it yet and I might need her to repeat some stuff. She was very nice and understanding, I would guess she was between seventeen and twenty five.
I asked what nationality she was but she would not say. The accent was not India, but again India does have many languages and probably accents. It did not seem like someone from China or vietnam or S. Korea. It did not seem like any islander or native American accents I have heard...but then again I only have heard accents from about five or six different tribes.
That was the most interesting poll I actually did, I was trying to analyze where she came from. She could have been from the USA, a child of an immigrant maybe from India or something, definitely not a muslim accent though.
I do not know the accents of many south American countries either, or accents of some Ukrainian groups either...definitely not an accent from Mexico or guatamala.
I really wish she would have told me what type of accent she had, it was actually pleasant sounding but so hard to understand because I have not heard one like it before.
a reply to: rickymouse
Nigerian princess.
The men catfish, the women poll.
I was trying to analyze where she came from.
Nigerian princess.
The men catfish, the women poll.
edit on 1/1/1908 by nugget1 because: sp
originally posted by: nugget1
a reply to: rickymouse
I was trying to analyze where she came from.
Nigerian princess.
The men catfish, the women poll.
I went looking for women who speak with her accent....I think she may have been French. I have heard older french people speaking english on TV and in person, but not anyone young speaking with a french accent. You tube is a place to go for this. I listened to multiple accents, but none from Nigeria on You tube. But there are also many other countries and cultures in the world, but I don't feel like listening to all of them, after listening to like five videos, my memory of that girls voice is already distorted now.
a reply to: rickymouse
That so funny, and indicative of the "scientific method " today's polls use.
Hell, I talk to hardly anybody on the phone, certainly not anybody I don't know at length.
I don't know if there is a political affiliation divide but most polls suggest Democrats are more apt to reply to poll calls, the elderly do as well.
a reply to: rickymouse
It was a joke, Ricky.
'Press one for English' means nothing nymore; you'll get some foriegner with such a heavy accent you need an interpretor to decipher what they're saying.
I listened to multiple accents, but none from Nigeria on You tube.
It was a joke, Ricky.
'Press one for English' means nothing nymore; you'll get some foriegner with such a heavy accent you need an interpretor to decipher what they're saying.
a reply to: putnam6
Lots more pollsters, just like there are a lot more hurricane prediction models.
But there are polls that have good track records for President. One is better for 6 months out, another for 3 months out, and another for 30 before the election.
If placing a bet, the best bet is the most historically accurate poll for when you're placing that bet.
Right now, the most accurate poll for 60 days prior to the election, is the best.
originally posted by: WeMustCare
a reply to: putnam6
Lots more pollsters, just like there are a lot more hurricane prediction models.
But there are polls that have good track records for President. One is better for 6 months out, another for 3 months out, and another for 30 before the election.
If placing a bet, the best bet is the most historically accurate poll for when you're placing that bet.
Right now, the most accurate poll for 60 days prior to the election, is the best.
Which polls are historically accurate?
and FWIW after 2020 I wouldn't bet a nickel on this election...
originally posted by: putnam6
originally posted by: WeMustCare
a reply to: putnam6
Lots more pollsters, just like there are a lot more hurricane prediction models.
But there are polls that have good track records for President. One is better for 6 months out, another for 3 months out, and another for 30 before the election.
If placing a bet, the best bet is the most historically accurate poll for when you're placing that bet.
Right now, the most accurate poll for 60 days prior to the election, is the best.
Which polls are historically accurate?
and FWIW after 2020 I wouldn't bet a nickel on this election...
Things are in such a flux historically, and the stakes are so high, some pollster organizations are no longer hiding what the owners of the organization want to accomplish.
Here's a communication from a pollster known as PublicPolicyPolling (PPP). PPP conducts the actual contact with people, on behalf of the "brand name" pollsters we see all the time. Here, it is describing the Kamala Harris lead...
Source: www.publicpolicypolling.com...
So Democrats should feel good right? Yes…but very cautiously so. Right now Harris is running a point ahead of Biden 2020.
But let’s say that instead there was a small shift in the race and instead she actually ran a point behind Biden 2020.
That would flip Arizona, Georgia, and Wisconsin into the Trump column and give him a 272-266 Electoral College win even as Harris won the popular vote by 3 points.
Make it a 1.2 point shift in Trump’s direction and Pennsylvania goes red too for a 291-247 win.
Things are going great right now. But that’s how thin the line is. 1.4 point movement in a Democratic direction from 2020, Harris wins by 100 electoral votes. 1.2 point movement in a Republican direction from 2020, Trump wins by 44 electoral votes.
That’s why it’s so important to sustain the energy and momentum from convention week for another ten weeks.
The majority of pollster CEOs want Kamala to beat Trump, and for the moment, it's easy for them to poll in ways that give Kamala Harris a lead. However, if Kamala Harris screws up like Joe Biden did, they will have to abandon her also.
FWIW THIS is well outside the double the3% margin for error


x.com...


x.com...
Post
See new posts
Conversation
InteractivePolls
@IAPolls2022
#Latest
@NateSilver538
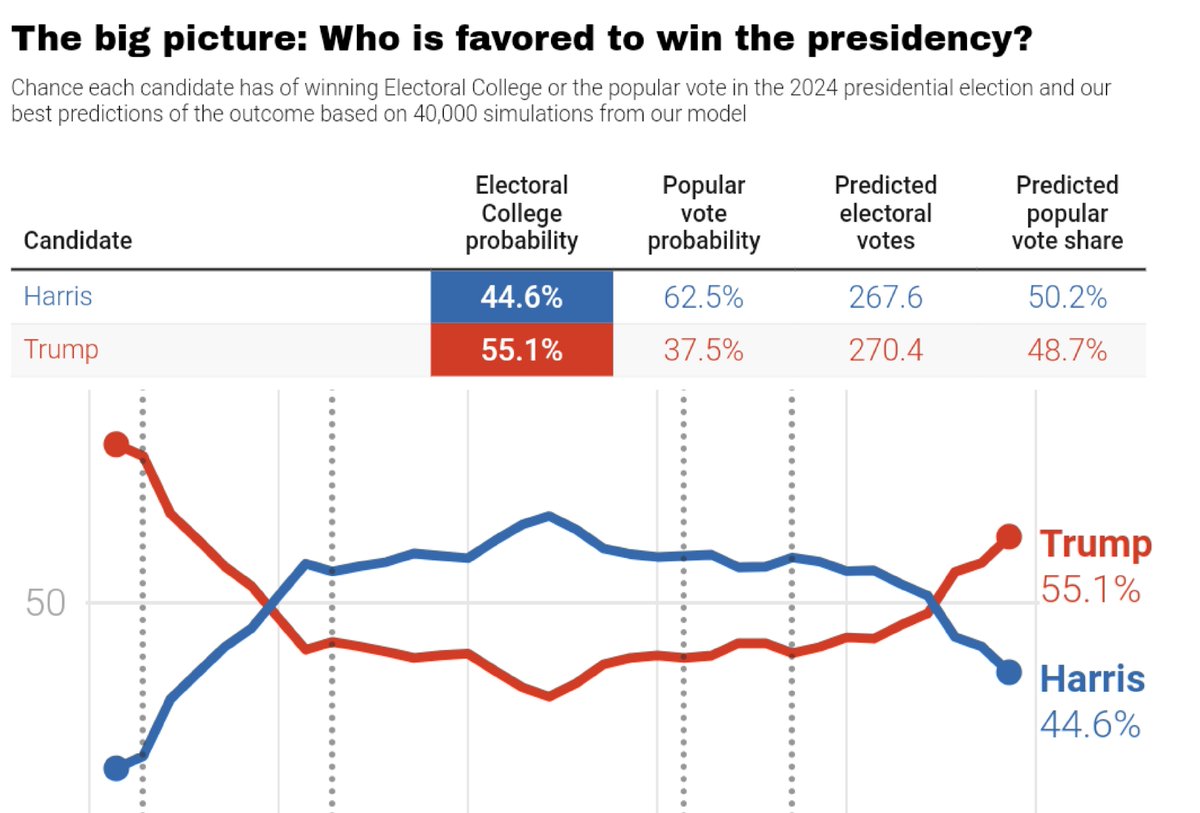
forecast (chance of winning)
August 14
🟦 Harris: 56.7%
🟥 Trump: 42.7%
.
August 31
🟥 Trump: 55.1%
🟦 Harris: 44.6%
——
Swing States: chance of winning
Pennsylvania - 🔴 Trump 55-45%
Nevada - 🔴 Trump 55-45%
Arizona - 🔴 Trump 65-35%
Georgia - 🔴 Trump 64-36%
North Carolina - 🔴 Trump 68-32%
Michigan - 🔵 Harris 53-47%
Wisconsin - 🔵 Harris 55-45%
——
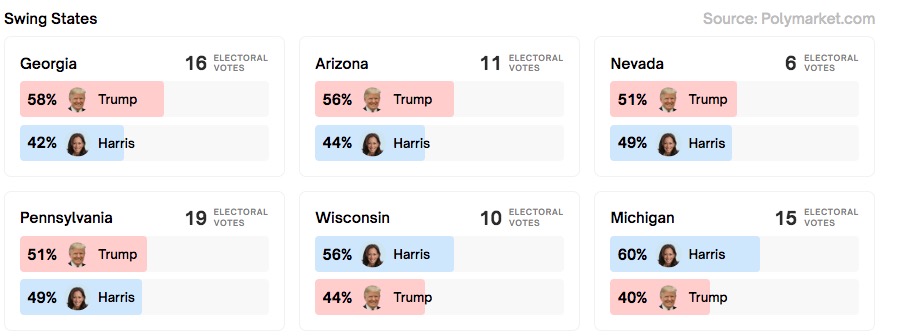
@Polymarket
odds
🟥 Trump: 50%
🟦 Harris: 48%
Polymarket swing states odds 👇
polymarket.com...

edit on p000000309pm096 by putnam6 because: -------
originally posted by: WeMustCare
a reply to: putnam6
Don't believe what you see for Wisconsin.
As long as they get to count fake votes and not be challenged by the rules as written, we will see more of the deep state drones ruining our world.
originally posted by: Justoneman
originally posted by: WeMustCare
a reply to: putnam6
Don't believe what you see for Wisconsin.
As long as they get to count fake votes and not be challenged by the rules as written, we will see more of the deep state drones ruining our world.
The "blame" ultimately falls on the voter however. The elected Governor of Wisconsin, Tony Evers(D), shot down every effort to perform a legitimate audit of Wisconsin's 2020 ballots...including the 20,000 that magically arrived at 3:00am on 2020 election late night.
new topics
-
Mass Extinctions May Hold the Key to Life in the Universe
Education and Media: 3 hours ago -
Can we be certain that Jesus Christ was born on December 25th?
Religion, Faith, And Theology: 5 hours ago -
RIP Merrily Harpur British Big Cat Realist
Cryptozoology: 7 hours ago
top topics
-
Panamanian President-“every square meter” of the Panama Canal belongs to Panama.
New World Order: 14 hours ago, 12 flags -
Australian mercenary caught and crying as he is a prisoner of war.
Other Current Events: 13 hours ago, 11 flags -
NYPD arrests migrant who allegedly set woman on fire on subway train, watched her burn to death
Breaking Alternative News: 17 hours ago, 10 flags -
JILL BIDEN Wants JOE to Punish Democrats Who Forced Him to Leave Office in Disgrace on 1.20.2025.
2024 Elections: 14 hours ago, 9 flags -
RIP Merrily Harpur British Big Cat Realist
Cryptozoology: 7 hours ago, 7 flags -
Mass Extinctions May Hold the Key to Life in the Universe
Education and Media: 3 hours ago, 4 flags -
Can we be certain that Jesus Christ was born on December 25th?
Religion, Faith, And Theology: 5 hours ago, 2 flags
active topics
-
Panamanian President-“every square meter” of the Panama Canal belongs to Panama.
New World Order • 25 • : fringeofthefringe -
-@TH3WH17ERABB17- -Q- ---TIME TO SHOW THE WORLD--- -Part- --44--
Dissecting Disinformation • 3793 • : Thoughtful3 -
Can we be certain that Jesus Christ was born on December 25th?
Religion, Faith, And Theology • 22 • : FullHeathen -
Well, here we go red lines crossed Biden gives the go ahead to use long range missiles
World War Three • 404 • : CriticalStinker -
The Daily Mail trying to imply “it’s aliens”
Dissecting Disinformation • 16 • : andy06shake -
NYPD arrests migrant who allegedly set woman on fire on subway train, watched her burn to death
Breaking Alternative News • 25 • : Flyingclaydisk -
F-18 shot down over Red Sea....by our own Destroyer?
Other Current Events • 13 • : Cosmo14 -
Mass Extinctions May Hold the Key to Life in the Universe
Education and Media • 1 • : BeyondKnowledge3 -
Australian mercenary caught and crying as he is a prisoner of war.
Other Current Events • 32 • : BedevereTheWise -
‘Something horrible’: Somerset pit reveals bronze age cannibalism
Ancient & Lost Civilizations • 19 • : Scratchpost
8
