It looks like you're using an Ad Blocker.
Please white-list or disable AboveTopSecret.com in your ad-blocking tool.
Thank you.
Some features of ATS will be disabled while you continue to use an ad-blocker.
share:
As of February 1st Denmark will remove all
restrictions.
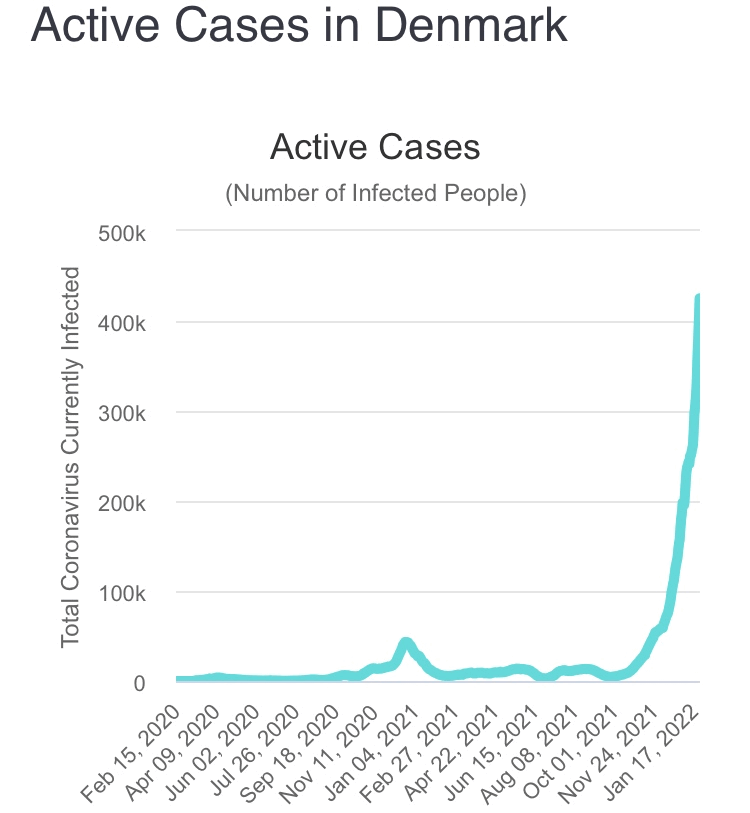
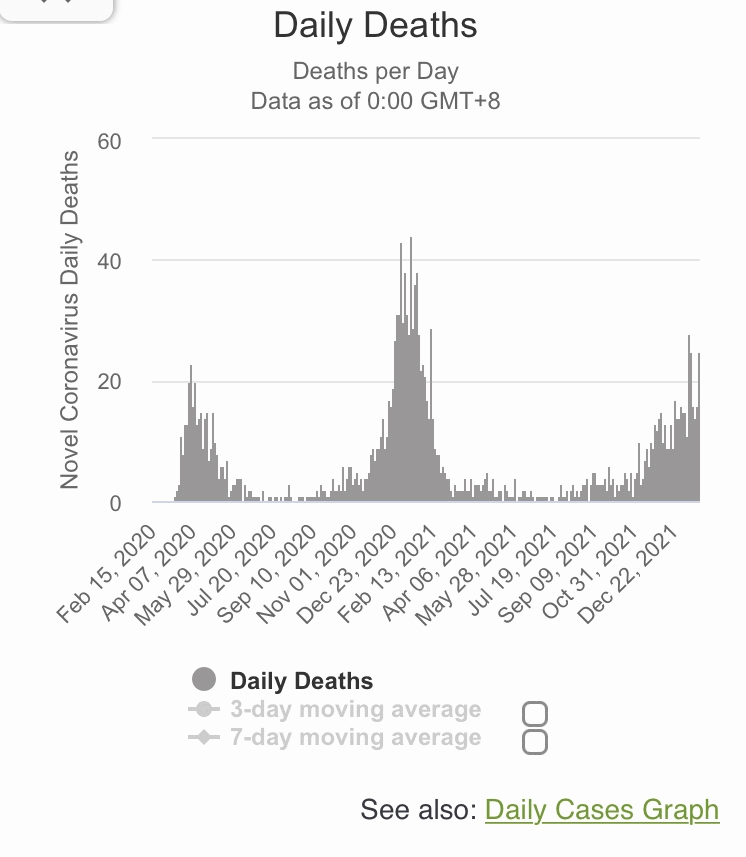
Analyzing the numbers it turns out that even though COVID has infected record numbers of Danes and even though number of hospitalized COVID patients have skyrocketed, the number of patients hospitalized BECAUSE of the virus has plummeted.
Let me repeat: While the number of COVID cases has skyrocketed, the number of actual COVID-hospitalizations has plummeted.
And that is why all restrictions will be lifted.
No masks, no mandates - no danger.
Edit:
Or so say the authorities.
Fingers crossed that they are right.
edit on 27-1-2022 by DupontDeux because: (no reason given)
I wonder what all mandate Karens will do now that they can't impose their insufferable paranoia on everyone else?
edit on 1 27 2022 by
projectvxn because: (no reason given)
a reply to: DupontDeux


So. Where in the graphs did vaccines, lockdowns, mandates make a difference…..


So. Where in the graphs did vaccines, lockdowns, mandates make a difference…..
As on 31-01 we're not able to go to a zoo, a museum or a bottle shop.
Without masks, and double vaxxed proof. FKN BOTTLOS... Who spends more than 30 seconds in one, or 40+ mins un a market??
Premier Mark MgGowan.

The guy is munted... needs a wallop upside the vaxxed arms he has..
Without masks, and double vaxxed proof. FKN BOTTLOS... Who spends more than 30 seconds in one, or 40+ mins un a market??
Premier Mark MgGowan.

The guy is munted... needs a wallop upside the vaxxed arms he has..
edit on 27-1-2022 by jerich0 because: (no reason given)
a reply to: neutronflux
The vax mandates, passports made no change. The masks dont colds/viruses. Are today's supposed health experts forgetting the lessons of 1918?
They dropped the masks.
The vax mandates, passports made no change. The masks dont colds/viruses. Are today's supposed health experts forgetting the lessons of 1918?
They dropped the masks.
a reply to: neutronflux
It is hard to tell, really, since we don't have a control group, but I guess Denmark will be the Worlds control group from here on out.
So we'll have to see how it develops from here.
So. Where in the graphs did vaccines, lockdowns, mandates make a difference…..
It is hard to tell, really, since we don't have a control group, but I guess Denmark will be the Worlds control group from here on out.
So we'll have to see how it develops from here.
a reply to: DupontDeux
I said that this would happen and I've been proved correct, and it's completely in line with the models from 2020 on which I based my stance.
Along with England removing restrictions this effectively debunks everyone who said that this was a conspiracy to control the population, or that it was a depopulation weapon.
The domino are falling, one by one, and it is all in line with mainstream science as regards pandemic flu.
New Cases figures are worse than a stupid joke --- they are meaningless and not based on any known science .
Regardless , Moronic is no worse than the common cold and given the seriousness of adverse reactions you would have to be mentally retarded to risk any sort of inoculation .
Regardless , Moronic is no worse than the common cold and given the seriousness of adverse reactions you would have to be mentally retarded to risk any sort of inoculation .
originally posted by: projectvxn
I wonder what all mandate Karens will do now that they can't impose their insufferable paranoia on everyone else?
Actually, to be honest, the 'Karens' I have met during the pandemic has mostly been the anti-mandate crowd.
Everyone has been pretty chill about it in Denmark and wherever possible we have sought to encourage rather than mandate, and you really haven't seen the fearmongering and the shaming that is present in many other countries.
When did Bill Gates say the pandemic would end? Summer 2022, or am I imagining that? Uncanny if true.
originally posted by: projectvxn
I wonder what all mandate Karens will do now that they can't impose their insufferable paranoia on everyone else?
easy...

a reply to: AaarghZombies
I said back then that you would say this now. I don't believe you. And fabric masks don't work against this virus. still.
I said back then that you would say this now. I don't believe you. And fabric masks don't work against this virus. still.
a reply to: AaarghZombies
What? Despite current high infection rates and about the same amount of peak deaths, that Denmark would contradict their logic of the past waves, lockdowns, and mandates.
What? Despite current high infection rates and about the same amount of peak deaths, that Denmark would contradict their logic of the past waves, lockdowns, and mandates.
edit on 27-1-2022 by neutronflux because: Added and fixed
originally posted by: Juicer66
New Cases figures are worse than a stupid joke --- they are meaningless and not based on any known science .
Regardless , Moronic is no worse than the common cold and given the seriousness of adverse reactions you would have to be mentally retarded to risk any sort of inoculation .
I disagree about the case figures being worthless.
Not the way it is presented here anyway.
The numbers have now been differentiated to show how many of the (hospitalization) cases are because of COVID and how many are simply someone being hospitalized for other reasons that simple happens to have caught COVID.
It is further specified how many COVID patients is in intensive care, and even further than that, how many of those need respiratory help.
It is these exact nuanced figures that have been useful in deciding to lift all restrictions.
Without the nuance they would indeed have been next to worthless though.
a reply to: network dude
You don't believe me even though it is actually happening right now?
Covid is following the models, which debunks the idea that this was manufactured as the models don't cover artificial situations
And cloth masks are effective if you wear a good quality one properly. People wearing them on their chins or wearing bandana does not prove anything except that people are stupid. They're just not 100 percent effective.
Even you know deep down that masks help, that's why you will never ever object to your dentist wearing one, or anybody involved in the birth of your children. Go on, tell me that you'd ask your midwife to remove her mask
I was right, the models were accurate, the domino are falling.
a reply to: AaarghZombies
LOL, I don't believe you called "way back then". You have been too busy tasting KIWI.
LOL, I don't believe you called "way back then". You have been too busy tasting KIWI.
originally posted by: DupontDeux
originally posted by: Juicer66
New Cases figures are worse than a stupid joke --- they are meaningless and not based on any known science .
Regardless , Moronic is no worse than the common cold and given the seriousness of adverse reactions you would have to be mentally retarded to risk any sort of inoculation .
I disagree about the case figures being worthless.
Not the way it is presented here anyway.
The numbers have now been differentiated to show how many of the (hospitalization) cases are because of COVID and how many are simply someone being hospitalized for other reasons that simple happens to have caught COVID.
It is further specified how many COVID patients is in intensive care, and even further than that, how many of those need respiratory help.
It is these exact nuanced figures that have been useful in deciding to lift all restrictions.
Without the nuance they would indeed have been next to worthless though.
These people don't want to talk about the nuance because putting the data into context destroys their narrate that this is a conspiracy.
Cases are up but harm is down because this coronavirus did exactly what was predicted of it using models that only take into account conventional factors, and not conspiracies or cover ups.
a reply to: AaarghZombies
You
What model predicted this with boosters…. And lockdowns


You
Covid is following the models,
What model predicted this with boosters…. And lockdowns


a reply to: DupontDeux
You want more cases ?
Do more tests .
With upward of 95% False Positives when you crank up the amplification cycles , the results are garbage .
If you crank up the cycles sufficiently you can get 100% False Positives , though you will not have the remotest idea what virus it is signalling , whether it is 'alive' or not , let alone which variant it is .
It is as moronic as Moronic also is .
a reply to: AaarghZombies
Just quit it.
Anyone who is in the construction industry knows that anything short of a NIOSH approved respirator with a properly performed fit test doesn't protect against anything. That's why cloth and paper masks are BANNED from the industry. Not even acceptable for drywall dust which is millions of times the size of respiratory particles.
Doctors wear masks so they don't spray something into your body cavity or mouth...
Smh at this bs.
new topics
-
George Stephanopoulos and ABC agree to pay $15 million to settle Trump defamation suit
Mainstream News: 52 minutes ago -
More Bad News for Labour and Rachel Reeves Stole Christmas from Working Families
Regional Politics: 7 hours ago -
Light from Space Might Be Travelling Instantaneously
Space Exploration: 8 hours ago -
The MSM has the United Healthcare assassin all wrong.
General Conspiracies: 9 hours ago -
2025 Bingo Card
The Gray Area: 9 hours ago -
The Mystery Drones and Government Lies
Political Conspiracies: 11 hours ago
top topics
-
The Mystery Drones and Government Lies
Political Conspiracies: 11 hours ago, 14 flags -
Light from Space Might Be Travelling Instantaneously
Space Exploration: 8 hours ago, 8 flags -
2025 Bingo Card
The Gray Area: 9 hours ago, 7 flags -
The MSM has the United Healthcare assassin all wrong.
General Conspiracies: 9 hours ago, 7 flags -
More Bad News for Labour and Rachel Reeves Stole Christmas from Working Families
Regional Politics: 7 hours ago, 7 flags -
George Stephanopoulos and ABC agree to pay $15 million to settle Trump defamation suit
Mainstream News: 52 minutes ago, 6 flags
active topics
-
George Stephanopoulos and ABC agree to pay $15 million to settle Trump defamation suit
Mainstream News • 5 • : NeedInfo -
They Know
Aliens and UFOs • 81 • : CarlLaFong -
Nov 2024 - Former President Barack Hussein Obama Has Lost His Aura.
US Political Madness • 13 • : Coelacanth55 -
Light from Space Might Be Travelling Instantaneously
Space Exploration • 19 • : Lazy88 -
2025 Bingo Card
The Gray Area • 15 • : onestonemonkey -
The Mystery Drones and Government Lies
Political Conspiracies • 65 • : Zaphod58 -
Drones everywhere in New Jersey
Aliens and UFOs • 128 • : angelchemuel -
-@TH3WH17ERABB17- -Q- ---TIME TO SHOW THE WORLD--- -Part- --44--
Dissecting Disinformation • 3681 • : Thoughtful3 -
Something better
Dissecting Disinformation • 25 • : Astrocometus -
Pelosi injured in Luxembourg
Other Current Events • 31 • : xuenchen
