It looks like you're using an Ad Blocker.
Please white-list or disable AboveTopSecret.com in your ad-blocking tool.
Thank you.
Some features of ATS will be disabled while you continue to use an ad-blocker.
23
share:
There has been a
story floating around that the voting data from The New York Times shows that votes were switched from Trump to Biden. I decided
to download the data for each state directly from NYT and write
my own script in node.js to confirm for myself whether this claim was true or not. I was looking for this data anyway because I wanted to check if the
large spike of Biden votes which occurred early in the morning was actually in the official data. Writing my own script would make it easier to see if
there were any bugs in the python script first used to find these anomalies in the data.
What I found is that Biden also loses a large number of votes, in fact more votes are taken from Biden than from Trump. Part of this mystery can be explained by the way the data is formatted. We are provided with the total vote count along with two fractions which can be used to calculate the number of votes for Trump and Biden. For example if Trump has 40% of the votes and Biden has 60% then the fractional value for Trump is 0.4 and it's 0.6 for Biden. You can multiply those fractions by the total vote count to get the number of votes for each candidate with reasonable accuracy.
The problem is each fraction has a maximum of 3 decimal places so it's not perfectly accurate and votes may be "lost" in some cases due to rounding errors. However those rounding errors are far too small to explain most of these anomalies, in a few instances several hundred thousand votes suddenly vanished. That means something besides rounding errors were involved, maybe glitches, typos, miscounts, etc. I decided the only real way to figure out what was going on here was to visualize it by graphing the data. Here is my analysis for 6 of the swing states which had some of these large anomalies.
As you can see from the first chart showing what happened in Virginia, Biden lost over 300 thousand votes, then gained around 400 thousand votes, then lost over 300 thousand votes, then gained over half a million votes, resulting in a massive Biden lead, all in a fairly short period of time. Such a high amount of volatility so late in the voting process would suggest to me something strange was happening in Virginia. It also turns out that the Biden spikes do appear in this data, not only in Michigan and Wisconsin, but also in Georgia. It's rather coincidental that these anomalies favor Biden so heavily.
Click on images to see them in full size and read my analysis of each state.
Virginia: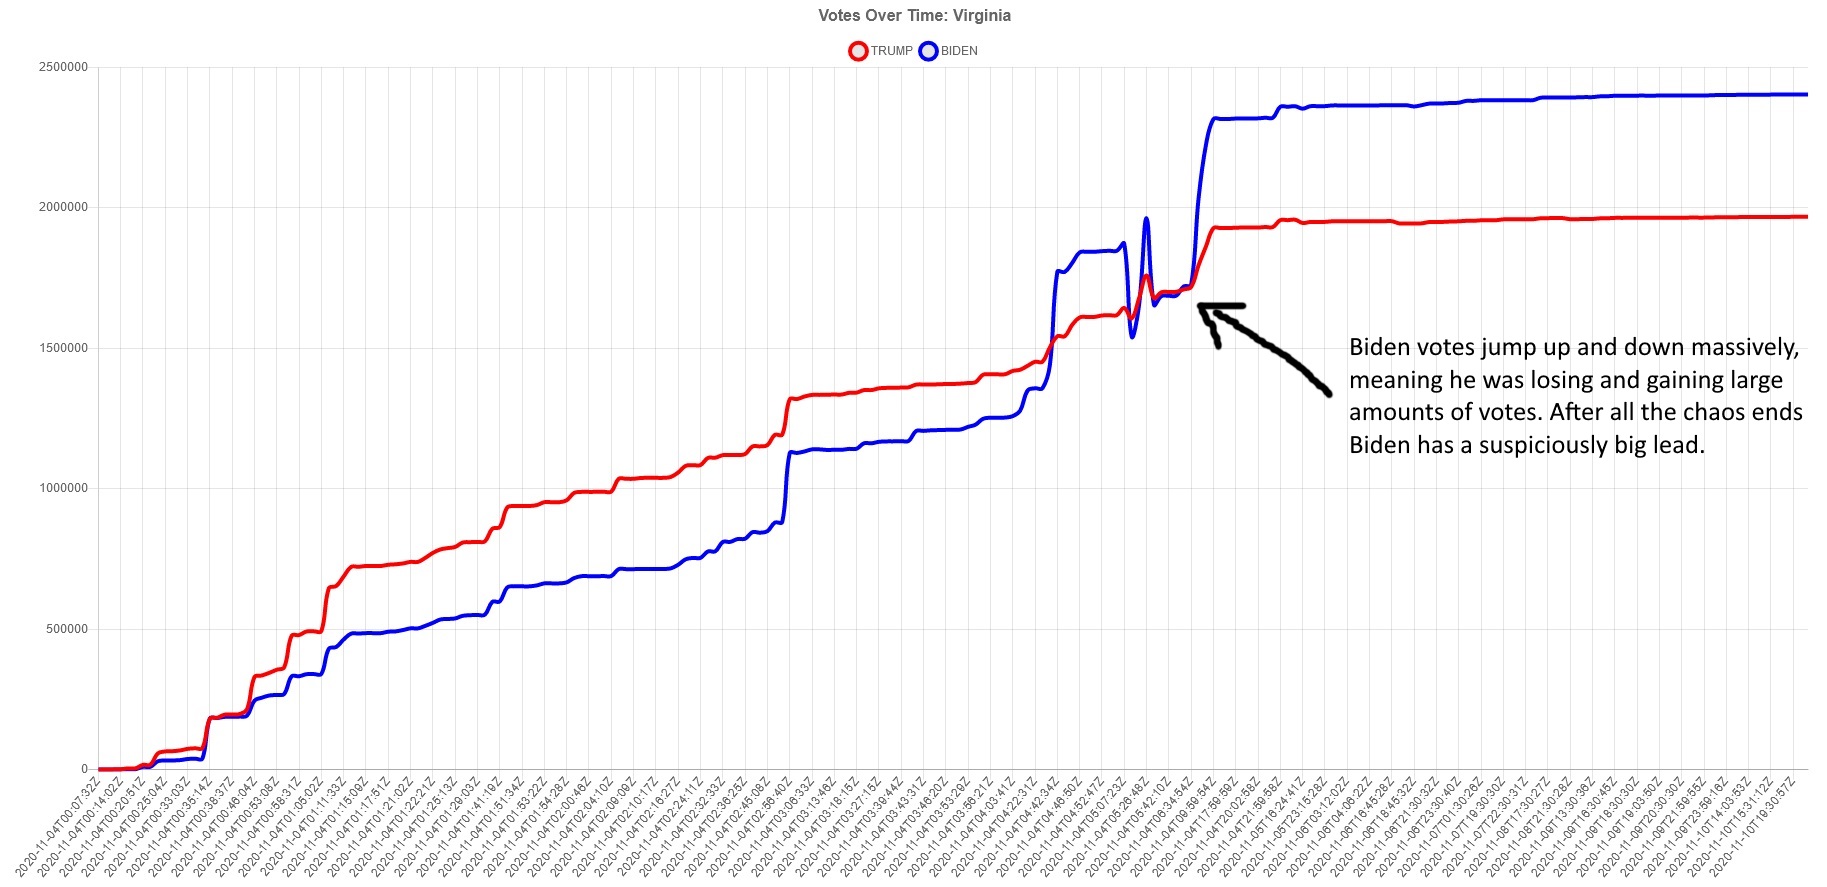
Michigan: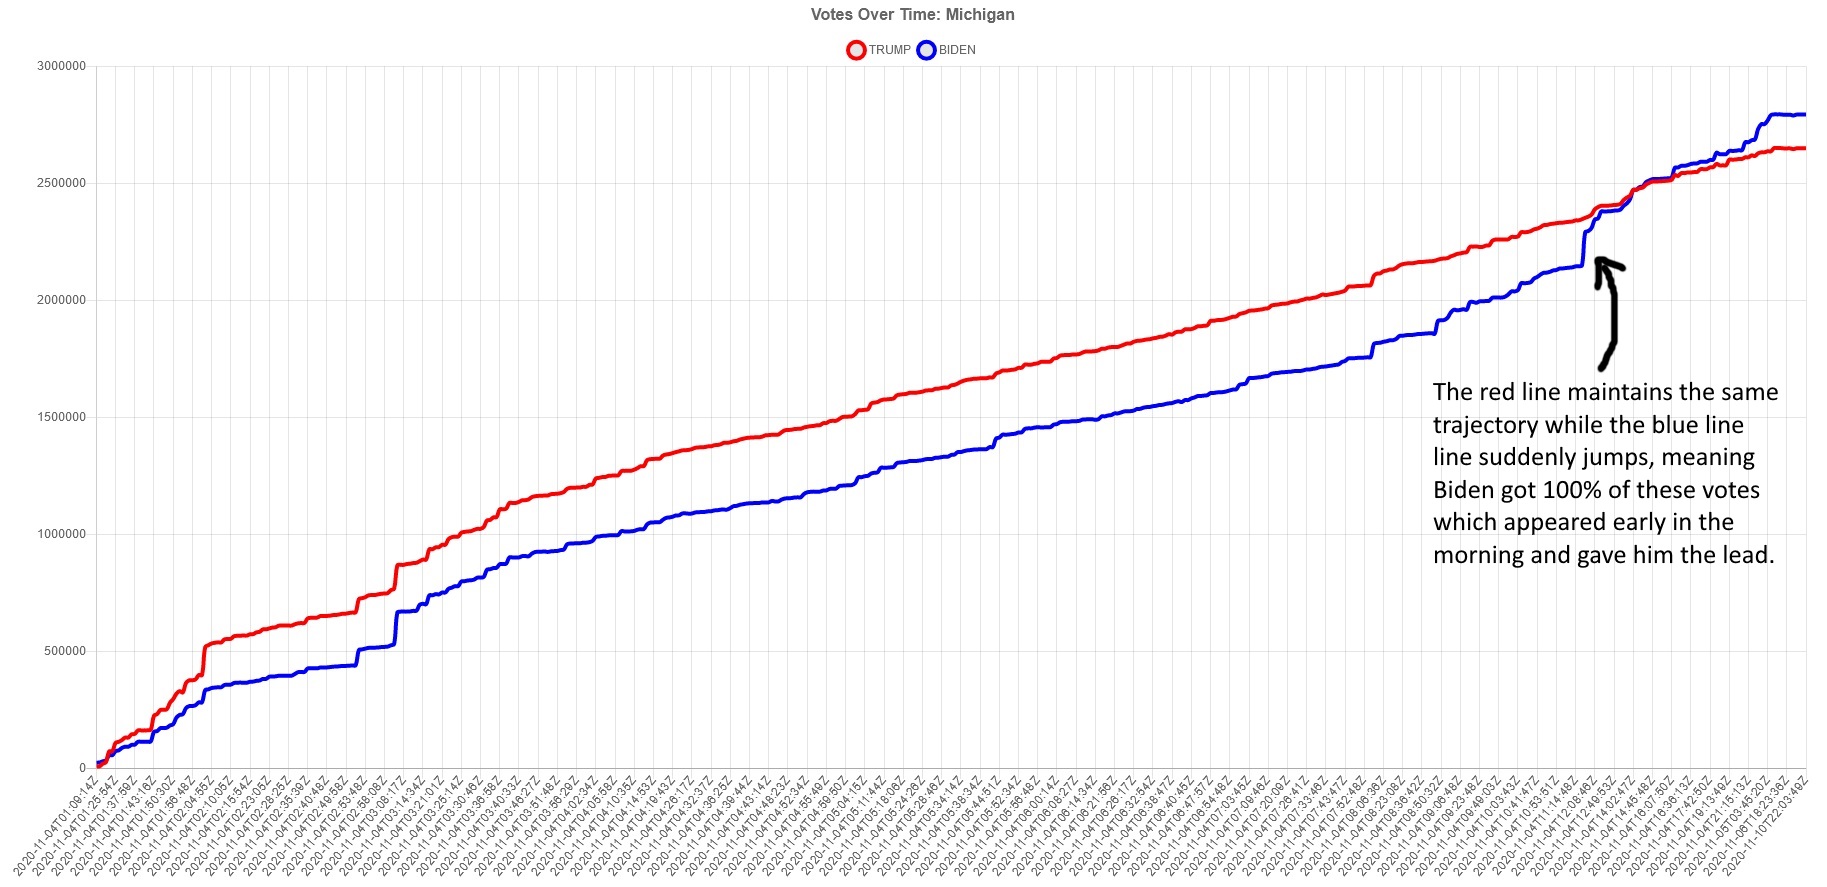
Wisconsin: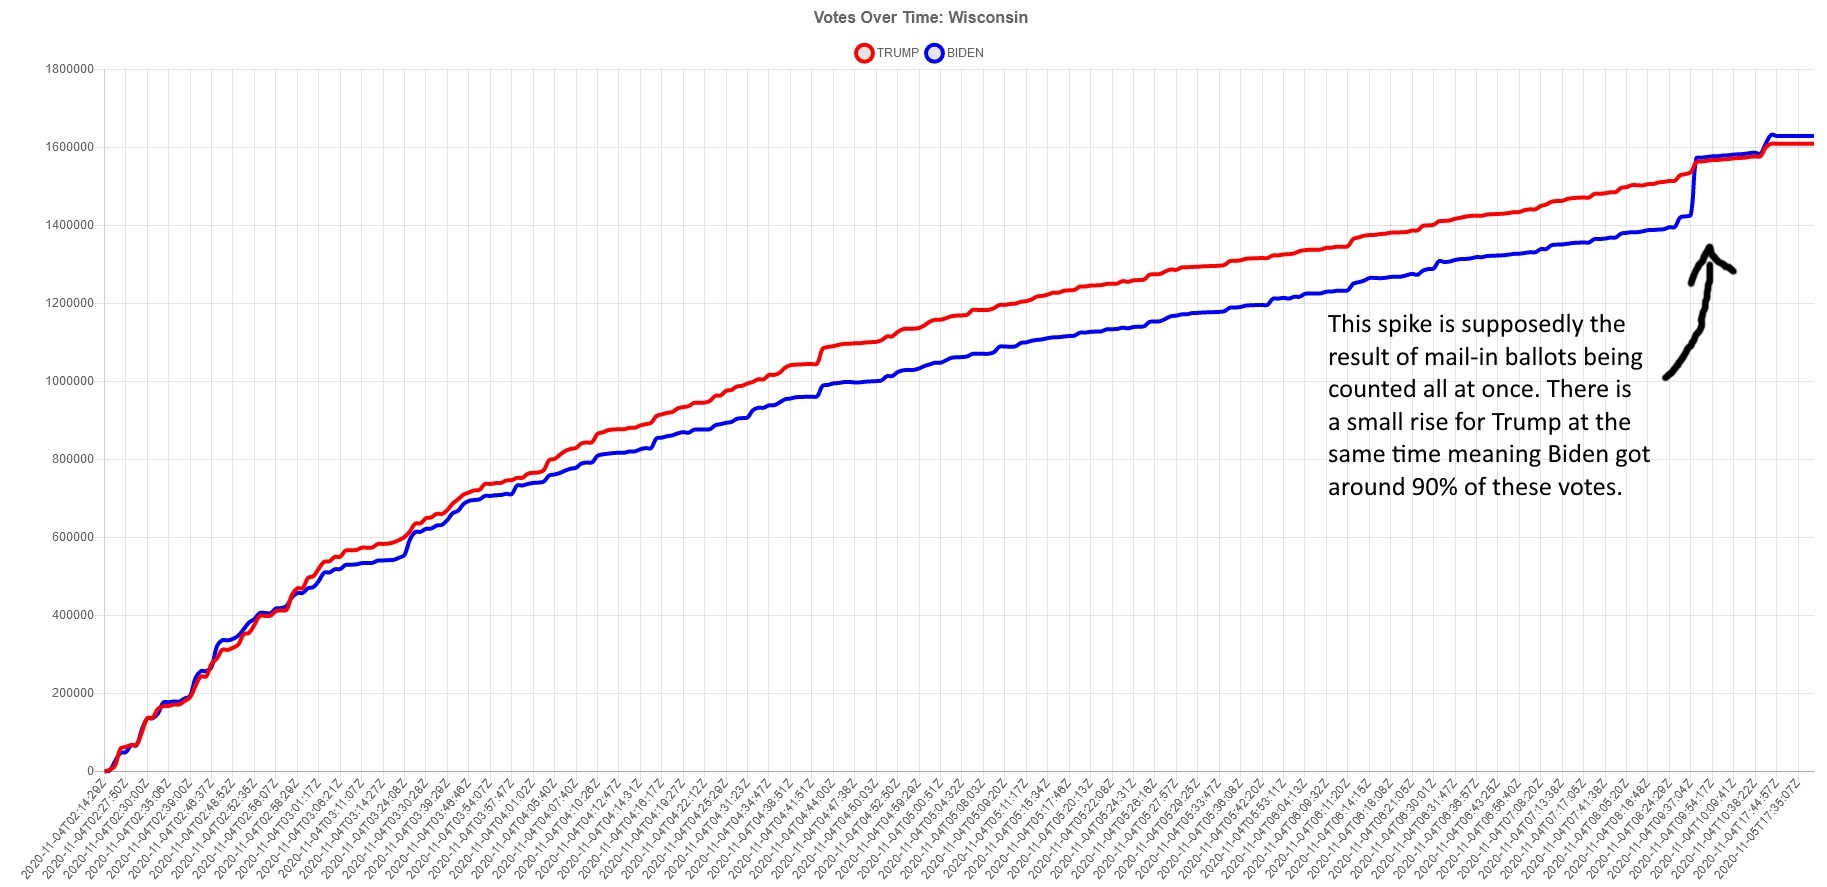
Georgia: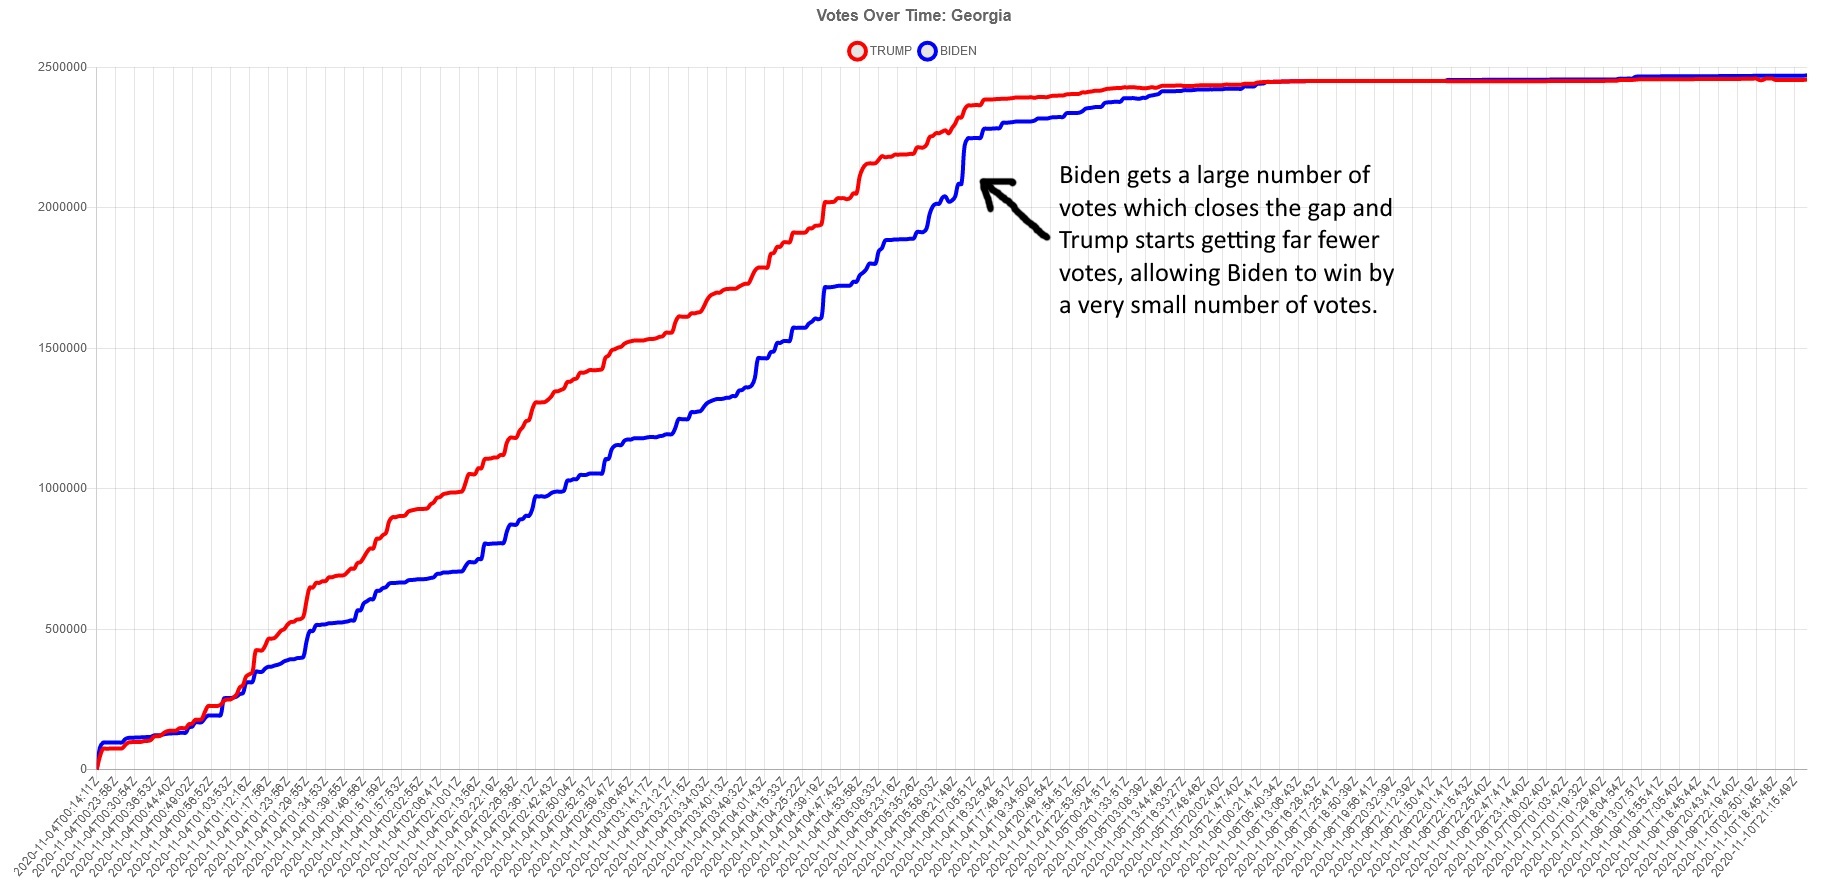
Pennsylvania: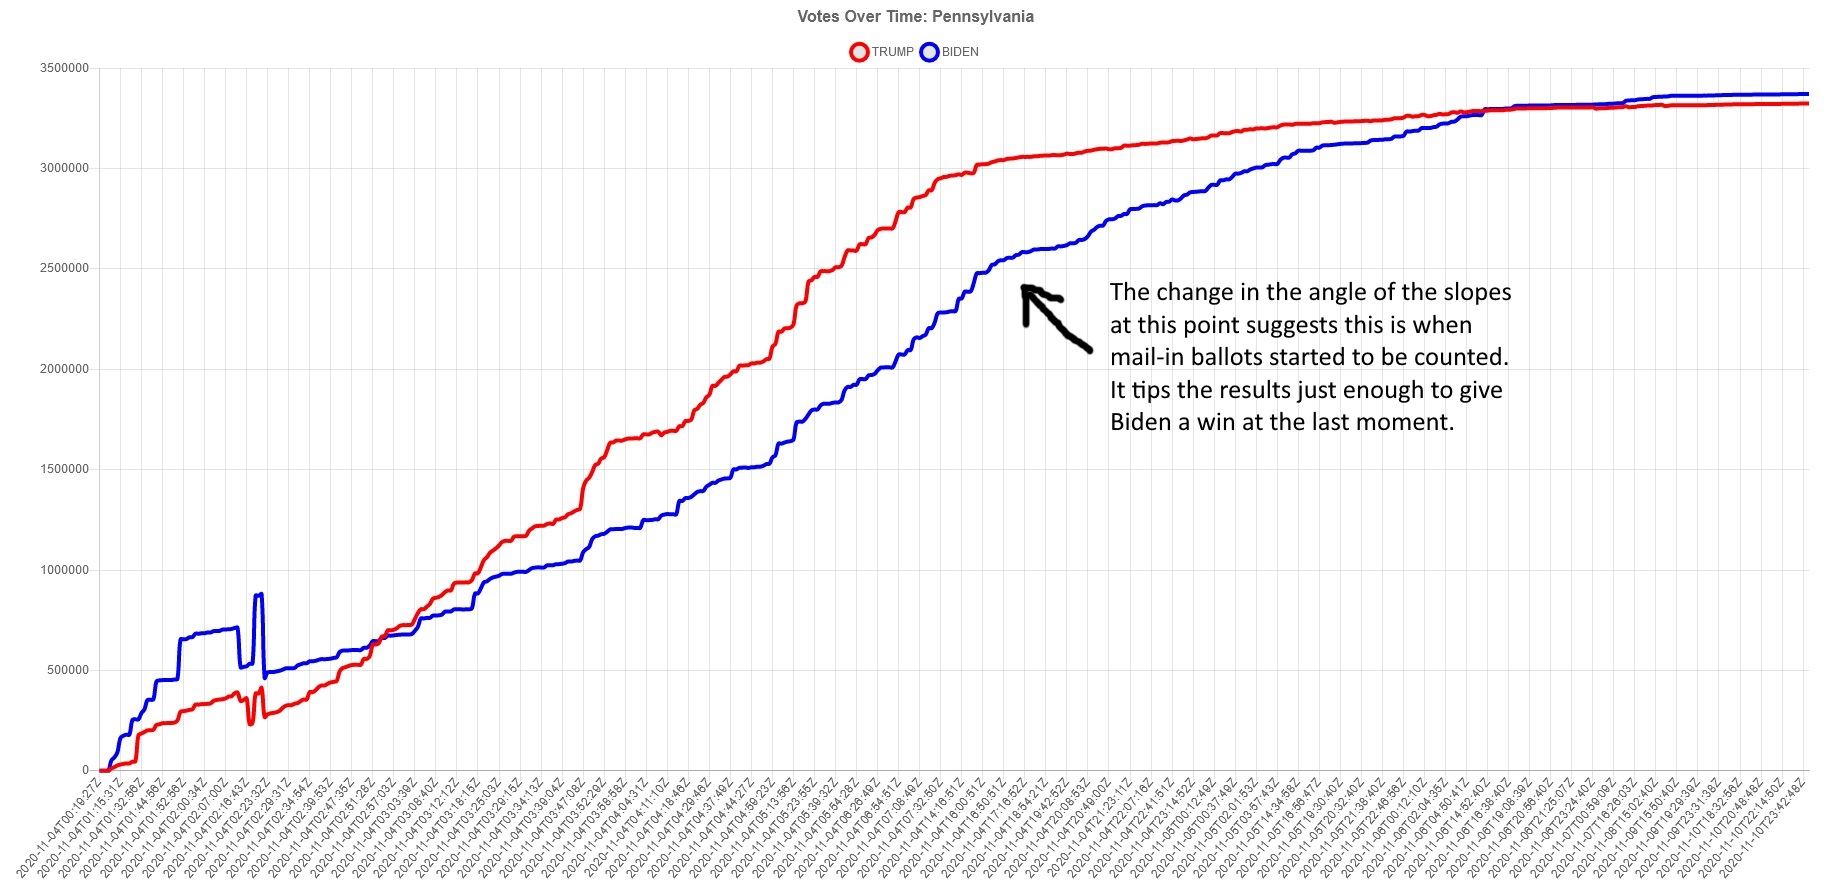
Nevada: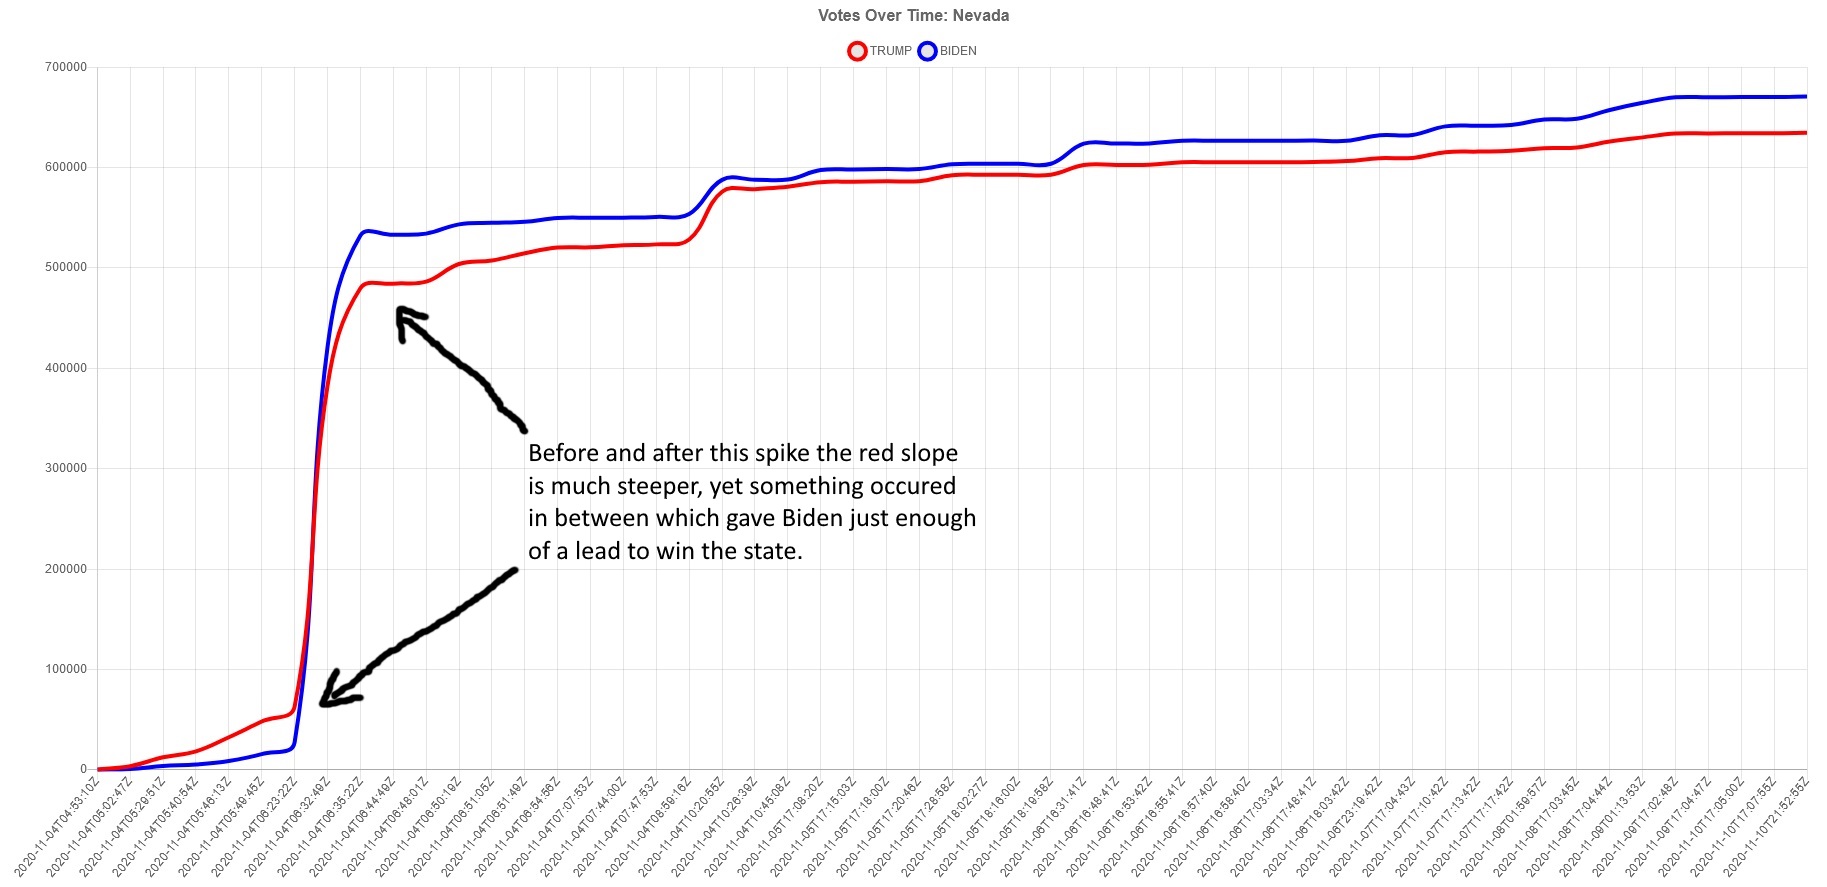
What I found is that Biden also loses a large number of votes, in fact more votes are taken from Biden than from Trump. Part of this mystery can be explained by the way the data is formatted. We are provided with the total vote count along with two fractions which can be used to calculate the number of votes for Trump and Biden. For example if Trump has 40% of the votes and Biden has 60% then the fractional value for Trump is 0.4 and it's 0.6 for Biden. You can multiply those fractions by the total vote count to get the number of votes for each candidate with reasonable accuracy.
The problem is each fraction has a maximum of 3 decimal places so it's not perfectly accurate and votes may be "lost" in some cases due to rounding errors. However those rounding errors are far too small to explain most of these anomalies, in a few instances several hundred thousand votes suddenly vanished. That means something besides rounding errors were involved, maybe glitches, typos, miscounts, etc. I decided the only real way to figure out what was going on here was to visualize it by graphing the data. Here is my analysis for 6 of the swing states which had some of these large anomalies.
As you can see from the first chart showing what happened in Virginia, Biden lost over 300 thousand votes, then gained around 400 thousand votes, then lost over 300 thousand votes, then gained over half a million votes, resulting in a massive Biden lead, all in a fairly short period of time. Such a high amount of volatility so late in the voting process would suggest to me something strange was happening in Virginia. It also turns out that the Biden spikes do appear in this data, not only in Michigan and Wisconsin, but also in Georgia. It's rather coincidental that these anomalies favor Biden so heavily.
Click on images to see them in full size and read my analysis of each state.
Virginia:

Michigan:

Wisconsin:

Georgia:

Pennsylvania:

Nevada:

a reply to: ChaoticOrder
It seems that most of those spikes were on the 4th. Odd how that works.
Kocag
It seems that most of those spikes were on the 4th. Odd how that works.
Kocag
a reply to: ChaoticOrder
Good stuff.
Not sure what conclusions can be drawn from it though?
If the votes were manipulated using software in the Dominion units, then it would be very easy to write an algorithm that could give you any result you wanted...
I think the only way to the truth is a Full Audit...
SnF
Good stuff.
Not sure what conclusions can be drawn from it though?
If the votes were manipulated using software in the Dominion units, then it would be very easy to write an algorithm that could give you any result you wanted...
I think the only way to the truth is a Full Audit...
SnF
a reply to: ChaoticOrder
No need I figured out what happened and deeply analyzed the results and put together a graph
is it coincidence we had a paper toilet shortage? I think not.
No need I figured out what happened and deeply analyzed the results and put together a graph
is it coincidence we had a paper toilet shortage? I think not.
edit on 551130America/ChicagoFri, 13 Nov 2020 08:55:36 -0600000000p3042 by
interupt42 because: (no reason given)
That proves it was manipulated in favor of Biden, correct?
edit on 13-11-2020 by Aallanon because: (no reason given)
originally posted by: Aallanon
That proves it was manipulated in favor of Biden, correct?
Not really....
All we can conclude from this, is that the data entry was all over the place....
An Audit is required to show where those votes came from...also, the Dominion units need to be looked at....before they upgrade the firmware....
Also one other important point I should mention is that this analysis doesn't necessarily debunk the idea that votes were switched. If Trump were to
lose a number of votes and then Biden gained that exact same number of votes it would be very suspicious, and I have seen news clips of that
occurring. I did analyze the NYT data for that happening but didn't find anything, however the limited accuracy format they use probably prevents it
from being easily detected.
edit on 13/11/2020 by ChaoticOrder because: (no reason given)
I just have a hard time believing that Biden who was in his basement for half the summer and couldn't even fill up a nursing home cafeteria on the
campaign trail somehow got more votes than not only Trump (who regularly could get 50,000 people to show up to a rally) was more popular than Barak
Obama.
Sure, orange man bad and strong TDS, but who am I going to believe... the results or my own eyes? I live in an ultra liberal town. When Obama ran, there were signs EVERYWHERE. I mean you knew the community supported Obama. With Hillary, not so much. It didn't surprise me she lost. they supported her, but the same enthusiasm wasn't there. Biden was even worse than Hillary.
Not only that, we also know for fact that Trump pulled larger numbers of minority votes.
Further, all these Biden votes didn't take time to vote down ticket at the same rate. So they vote Biden for President, but didn't really support Democrat congressmen?
I may not be able to conclusively prove it, but I know something isn't right. It doesn't pass the smell test for anyone who is remotely aware politically.
On the flip side,
Democrats successfully weaponized COVID propaganda in combination with changing rules for mail in voting and were able to get enough people to mail in votes legally and illegally that is made a difference.
Or combination of both.
Either way, it is massive manipulation of our electoral process.
a reply to: ChaoticOrder
If I were to be imaginative, it looks to me like in some of those graphs, votes are being added, then subsequently removed. Almost like there were two sides fighting
to affect the votes.
If I knew hacking was going on, was watching it happen in real time and also had tools to "reverse" those hacks, I would do so just to mess with their heads!
a reply to: Edumakated
I have a hard time believing this election charade is nothing more than intentional continued division.
They (msm) started the fraud talk before the elections
All the filming of fraud, the lockdown of polling places, kicking out Republicans etc..
Constant reminder of the communists.
The covid bs.
It's starting to get stale.
I have a hard time believing, the people who've been crying for 4 years, spent a summer of love killing people. Would act honorably in an election.
When talking heads and journalists who had burning buildings behind them, say everything is peaceful, I'm suppose to believe they're giving facts and not opinions?
Systematically, they have proven to be inept and willing to do anything, by any means necessary. When you hold aid for your citizens, cause you can't get cheese for your backed organizations, you think they'll run a fair election?
new topics
-
Scary video of face in an abandoned house
Paranormal Studies: 1 hours ago -
Just Came Across These Unusual Old UFO Pics
Aliens and UFOs: 3 hours ago -
LA Mayor Bass Demanded $49M in Additional LAFD Cuts One Week Before Wildfires
Mainstream News: 5 hours ago -
Sepultura - Territory - With New Drummer Greyson Nekrutman
Music: 6 hours ago -
Carry On!
Short Stories: 6 hours ago
top topics
-
This should be plastered all over the airwaves
Mainstream News: 12 hours ago, 23 flags -
LA Mayor Bass Demanded $49M in Additional LAFD Cuts One Week Before Wildfires
Mainstream News: 5 hours ago, 17 flags -
Archbisop Vigano Warns of Deep State and Deep Church
New World Order: 14 hours ago, 16 flags -
Oh, Good Gosh. “Kremlin Warns Stay Away from Greenland.”
World War Three: 14 hours ago, 11 flags -
Just Came Across These Unusual Old UFO Pics
Aliens and UFOs: 3 hours ago, 4 flags -
Carry On!
Short Stories: 6 hours ago, 3 flags -
Sepultura - Territory - With New Drummer Greyson Nekrutman
Music: 6 hours ago, 2 flags -
Scary video of face in an abandoned house
Paranormal Studies: 1 hours ago, 2 flags
active topics
-
Trump says ownership of Greenland 'is an absolute necessity'
Other Current Events • 161 • : Imhere -
Dr. Demento
Music • 16 • : baddmove -
Los Angeles brush fires latest: 2 blazes threaten structures, prompt evacuations
Mainstream News • 365 • : Wookiep -
Statements of Intent from Incoming Trump Administration Members - 2025 to 2029.
2024 Elections • 64 • : WeMustCare -
This should be plastered all over the airwaves
Mainstream News • 54 • : fringeofthefringe -
Archbisop Vigano Warns of Deep State and Deep Church
New World Order • 9 • : CosmicFocus -
Post A Funny (T&C Friendly) Pic Part IV: The LOL awakens!
General Chit Chat • 8015 • : baddmove -
Carry On!
Short Stories • 2 • : JJproductions -
Scary video of face in an abandoned house
Paranormal Studies • 0 • : ColeYounger2 -
Oh, Good Gosh. “Kremlin Warns Stay Away from Greenland.”
World War Three • 30 • : ARM19688
23

