It looks like you're using an Ad Blocker.
Please white-list or disable AboveTopSecret.com in your ad-blocking tool.
Thank you.
Some features of ATS will be disabled while you continue to use an ad-blocker.
Researchers Slams Global Warming:"Not Reality-Totally Inconsistent With Credible Temperature Data"
page: 2share:
More ZeroHedge and Heartland Institute bullsh!t. Here, you need to read this blog:
Blog
It explains how and why the temperatures were altered, and they are valid reasons. Some highlights:
You need to stop believing these pseudo-science articles pushed by the alt-right and understand the real science.
Blog
It explains how and why the temperatures were altered, and they are valid reasons. Some highlights:
Joe D’Aleo, co-author of the CEI-affiliated report, made the embarrassingly uninformed and wrong claim that “nearly all of the warming they are now showing are in the adjustments.”
The report "On the Validity of NOAA, NASA and Hadley CRU Global Average Surface Temperature Data & The Validity of EPA’s CO2 Endangerment Finding - Abridged Research Report" (with annotations) by James P. Wallace III, Joseph S. D’Aleo, and Craig D. Idso provides no evidence for this claim; the graph above shows the opposite is true.
Bucket measurements are made by hauling a bucket of water from the ocean and stirring a thermometer until it has the temperature of the water. The problem is that the water cools due to evaporation between the time it is lifted from the ocean and the time the thermometer is read.
This is not only a large adjustment, but also a large uncertainty. Initially is was estimated that the bucket measurements were about 0.4 °C colder. Nowadays the estimate, depending on the bucket and the period, is about 0.2 °C, but it can be anywhere between 0.4 °C and zero.
The graph below shows the warming over land as estimated from weather station data by US NOAA (GHCNv3). Over land the warming was larger than the raw observations suggest. The adjustments are made by comparing every candidate station with its nearby neighbours. Changes in the regional climate will be the same in all stations, any change that only happens at the candidate station is not representative for the region, but likely a change in how temperature was observed.
You need to stop believing these pseudo-science articles pushed by the alt-right and understand the real science.
edit on 16-7-2017 by redtic
because: (no reason given)
originally posted by: seasonal
a reply to: redtic
The temps being altered consistently from 1997? Pretty much in one direction?
Sure.
That "report" used only land temperatures to tout their biased claims. When combined with the sea temperature adjustments, it actually results in a *reduction* of global warming from the raw data.
A tweet
Again, you need to learn and understand the science behind it. If you just go by zerohedge articles and your feelings, you're going to remain in the dark.
a reply to: redtic
Fact, fact and facts.
There are always differing facts. The problem with this particular political football is that there is huge $$$ on the status quo and there are huge $$$$ to jump on a global warming train.
If global warming is happening, we don't know why. It is a fact that it has indeed happened before. before internal combustion engines and mass production.
Way too much $$$ involved either way.
originally posted by: seasonal
So China, a huge polluter, would have no obligation to reduce their greenhouse gas. On the other hand, the US would have to, and on top of that China would get US tax $$ too. Trump pulled out of the Paris deal, this will force a even handed approach to green house gas reduction.
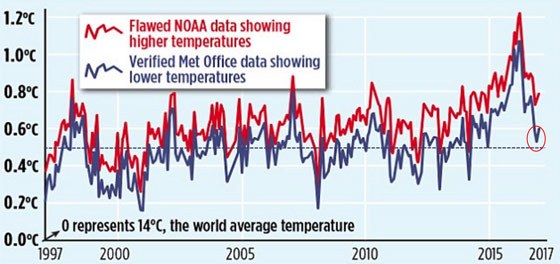
NOAA's temp #'s are consistently higher than actual temp readings. Almost like it was planned or something.
www.zerohedge.com...
As world leaders, namely in the European Union, attack President Trump for pulling out of the Paris Climate Agreement which would have saddled Americans with billions upon billions of dollars in debt and economic losses, a new bombshell report that analyzed Global Average Surface Temperature (GAST) data produced by NASA, the NOAA and HADLEY proves the President was right on target with his refusal to be a part of the new initiative.
According to the report, which has been peer reviewed by administrators, scientists and researchers from the U.S. Environmental Protection Agency (EPA), The Massachusetts Institute of Technology (M.I.T.), and several of America’s leading universities, the data is completely bunk:
Complete bunk, this is what MIT and several leading US universities called the GAST data produced by NASA, the NOAA and HADLEY. Seems like Trump made the right call.
Didn't you already do a thread on this?
I mean, this thread you authored (and ran away from) links through TheDailyCaller to this PDF.
ZeroHedge, which you have cited in this thread, also links to this same PDF.
Are they not one in the same thing? You never answered my rebuttal to it in the previous thread, either:
originally posted by: Greven
Gore never said anything about no ice by 2013.
Also, that 'study' is pretty dumb. It purposely looks at old data (pre-2010) because more recent data would destroy it.
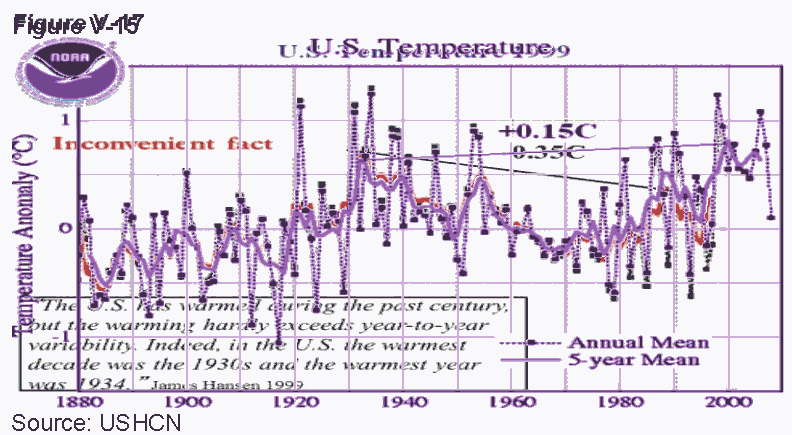
Additionally, it distorts things to make unfounded claims. For example, here are two charts from the 'study' and their dumb rhetoric:
Thus, it seems that beyond any doubt, the U.S. data reflected in the Global Average Surface Temperature data calculation should contain the cyclical patterns shown above. In fact, as shown below in Figure V-15, as of 1999, in NOAA data, it did!
*chart V-15, the red line in the overlay below*
...
The solution: the U.S.historical data was adjusted as shown in Figure V-17.
*chart V-17, the purple line in the overlay below*
Here's how those charts look like compared to each other to annihilate that rhetoric:
I had to adjust the height by 92% and the width by 104% from the second to match up closely with the first. This is how they mislead you.
Far be it from a vast adjustment, it's simply because it's been warmer since 1999 that the trend changed so much.
originally posted by: seasonal
a reply to: redtic
Fact, fact and facts.
There are always differing facts. The problem with this particular political football is that there is huge $$$ on the status quo and there are huge $$$$ to jump on a global warming train.
If global warming is happening, we don't know why. It is a fact that it has indeed happened before. before internal combustion engines and mass production.
Way too much $$$ involved either way.
WTF are you talking about? We're discussing your OP, which is attempting to state that NOAA maliciously altered temperature data, and I've shown that that is not true. What part of that don't you understand?
Oh, wait, were you just focusing on that chart?
That ZeroHedge thing is linking to an article from February that was easily debunked the day it was posted:
Shockingly, if the base period is different, the data appear offset by the amount of the difference between the base.
That ZeroHedge thing is linking to an article from February that was easily debunked the day it was posted:
However, the newspaper failed to adjust for the fact that the two datasets use different baselines. NOAA, and the paper by Dr Karl and co-authors, use the average for the period between 1901 and 2000, while the Met Office instead uses the average between 1961 and 1990 as its baseline.
Shockingly, if the base period is different, the data appear offset by the amount of the difference between the base.
edit on 22Sun, 16 Jul
2017 22:41:00 -0500America/ChicagovAmerica/Chicago7 by Greven because: (no reason given)
I think it is supposed to get down to thirty six degrees tonight here in the UP. Of course, global warming is to blame for these low temperatures. I
have seen a blizzard while watching the fireworks one fourth of July years ago in Houghton though so this is not unnatural.
This thread is a microcosm of what the true fake news is, and why it is so dangerous.
originally posted by: seasonal
a reply to: Greven
I think we will find this is all a cycle, more or less. There is no thermostat that we can set to 72 degrees.
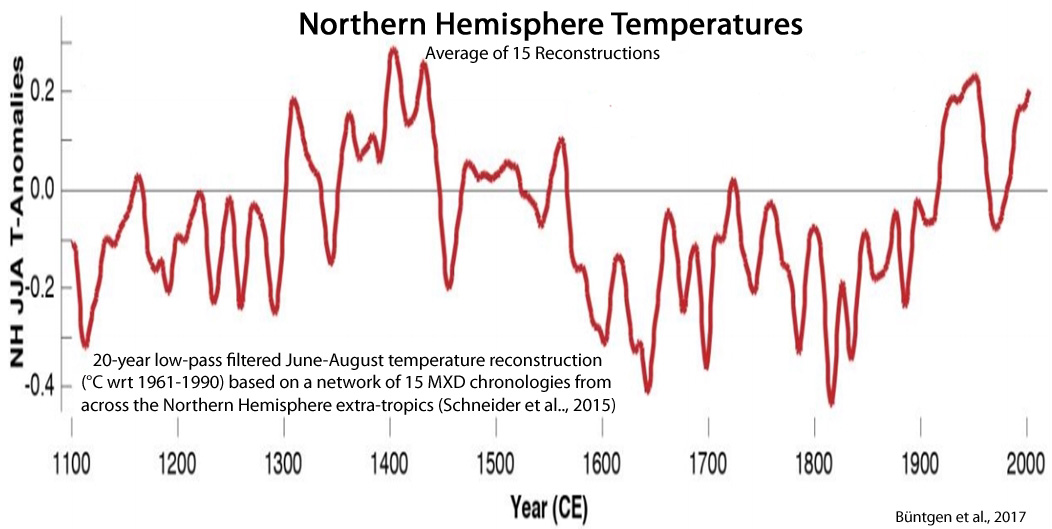
Your image contradicts itself, because someone with an agenda altered it:
The lines are left unchanged, but take note of how the added text contradicts itself. Near the top, it says "Average of 15 Reconstructions." In the bottom left corner, it says:
20-year low-pass filtered June-August temperature reconstruction (°C wrt 1961-1990) based on a network of 15 MXD chronologies from across the Northern Hemisphere extra-tropics (Schneider et al., 2015)
A single reconstruction created by using 15 chronologies as proxies is not an "Average of 15 Reconstructions." There is only one reconstruction, and it is not created by taking the average of series. The added text is simply wrong.
You should probably start using Google Image Search and maybe you should also question claims before deciding it must be true.
a reply to: rickymouse
I think we will find this is a cycle with little blips of hot or cold weather. Just as it has always been.
I think we will find this is a cycle with little blips of hot or cold weather. Just as it has always been.
originally posted by: seasonal
a reply to: Greven
I think we will find this is all a cycle, more or less. There is no thermostat that we can set to 72 degrees.
And you're a heretic! How dare you question the high priests? How dare you apply a skeptical attitude toward a scientific theory? How dare you attempt to limit the power of the high priests? You'd better flee before you are called before the Climate Change Inquisition! They'll put you in jail and feed you tofu.
Climate change IS real, and the United States is the only country full of people that refuse to believe it (explain to me again how Norwegian or
Japanese scientists adjust their findings to get federal grant money from the U.S.government?... as the conspiracy theory says). That's really
unfortunate, because the world-altering results are starting to kick in pretty hard right now, and people are doing something about it.
It's only a matter of time before economic solutions come up, and if all of you are so busy screaming "It's not real! It's not real!" You're never going to find your way to the table where people make the big decisions. And if there is a tax, it will fall heaviest on you, yes, you specifically, because you were not there to offer another solution, you were too busy making climate change worse and arguing about it. You have to defend your own rights, you know that.
So maybe it would benefit you all to read international scientific publications (and I don't mean the IPCC report, I mean original, peer-reviewed scientific literature), look at the projections from the early models (Spoiler alert: They came true!) and start to think about how to use less energy yourself AND how to make sure the big companies that did this to us all pay their share... otherwise they will dump the cleanup all on you, and people who would have been your allies will not bat an eye because they are so tired of trying to explain basic science to you that they won't care at all.
Look, I know science has had a bad reputation for a while now, and I know the government never seems to have your interests at heart. Well, you can judge the quality of science based on the grubby fingers of corporate interests, but in this case, it's the rich oil companies who stand to lose money from climate change, and they are the ones spreading these denialist lies for their own profit. You can tell climate change is real and will hurt you because politicians have thus far done practically nothing to actually change it. Don't you think if politicians were making this up just to screw you over, they would have successfully screwed you a few decades ago?
edit on 17-7-2017 by anotheramethyst because: Spelling
Well, I mean, no offense, but on the one hand you've got a website opinion piece and a guy from Fox news, and on the other hand, you've got 99% of the
worlds scientists.
I've gotta go with 99% of the worlds scientists on this one. Sorry.
Also I seen in comments that Graven has thoroughly debunked OPs article. So I fear this one needs moved to LOL, no?
I've gotta go with 99% of the worlds scientists on this one. Sorry.
Also I seen in comments that Graven has thoroughly debunked OPs article. So I fear this one needs moved to LOL, no?
edit on
-05:00am48731America/ChicagoMon, 17 Jul 2017 05:48:47 -0500197 by Painterz because: (no reason given)
new topics
-
World's Best Christmas Lights!
General Chit Chat: 2 hours ago -
Drone Shooting Arrest - Walmart Involved
Mainstream News: 3 hours ago -
Can someone 'splain me like I'm 5. Blockchain?
Science & Technology: 4 hours ago -
Squirrels becoming predators
Fragile Earth: 4 hours ago -
Labour's Anti-Corruption Minister Named in Bangladesh Corruption Court Papers
Regional Politics: 5 hours ago -
Have you noticed?? Post Election news coverage...
World War Three: 5 hours ago -
Georgia appeals court disqualifies DA Fani Willis from Trump election interference case
US Political Madness: 8 hours ago
top topics
-
Georgia appeals court disqualifies DA Fani Willis from Trump election interference case
US Political Madness: 8 hours ago, 24 flags -
Have you noticed?? Post Election news coverage...
World War Three: 5 hours ago, 11 flags -
Squirrels becoming predators
Fragile Earth: 4 hours ago, 8 flags -
Labour's Anti-Corruption Minister Named in Bangladesh Corruption Court Papers
Regional Politics: 5 hours ago, 6 flags -
Drone Shooting Arrest - Walmart Involved
Mainstream News: 3 hours ago, 5 flags -
World's Best Christmas Lights!
General Chit Chat: 2 hours ago, 5 flags -
Can someone 'splain me like I'm 5. Blockchain?
Science & Technology: 4 hours ago, 3 flags
active topics
-
Can someone 'splain me like I'm 5. Blockchain?
Science & Technology • 31 • : IndieA -
Drone Shooting Arrest - Walmart Involved
Mainstream News • 13 • : nerbot -
ILLUMINATION – Reverse Perception Of Cyclic Probability – CEO ASSASSINATION
Secret Societies • 32 • : Compendium -
Have you noticed?? Post Election news coverage...
World War Three • 7 • : nugget1 -
-@TH3WH17ERABB17- -Q- ---TIME TO SHOW THE WORLD--- -Part- --44--
Dissecting Disinformation • 3760 • : 777Vader -
Russias War Against Religion in Ukraine
World War Three • 46 • : andy06shake -
Squirrels becoming predators
Fragile Earth • 24 • : rickymouse -
The Mystery Drones and Government Lies --- Master Thread
Political Conspiracies • 144 • : charlyv -
US Federal Funding set to Expire December 20th. Massive CR on the way.
Mainstream News • 26 • : burntheships -
It's time to dissect the LAWFARE
Dissecting Disinformation • 18 • : burntheships


