It looks like you're using an Ad Blocker.
Please white-list or disable AboveTopSecret.com in your ad-blocking tool.
Thank you.
Some features of ATS will be disabled while you continue to use an ad-blocker.
share:
With the stock market headed to the moon, perhaps this is an appropriate timed thread... or maybe premature... I can't time it precisely.
Just in case anyone hasn't heard of the PPT, here is a wiki:
en.wikipedia.org...
I'm not really trying to start a discussion about what the PPT does, I just thought it was a catchy title for my first new thread posted on ATS.
I am trying to show why the stock market should plunge, using 4 simple charts, and basic algebra.
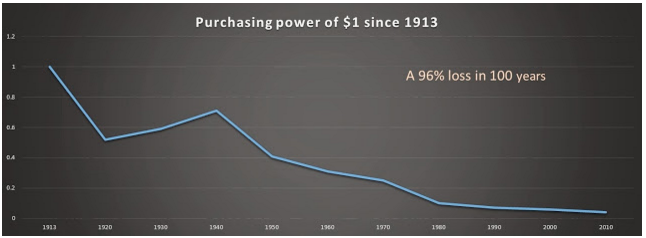
I open with a graph, using data from the USA Bureau of Labor Statistics.
It shows buying power of the USA dollar since 1913. It shows a 7 year interval, from 1913 to 1920, then after that 10 year intervals.

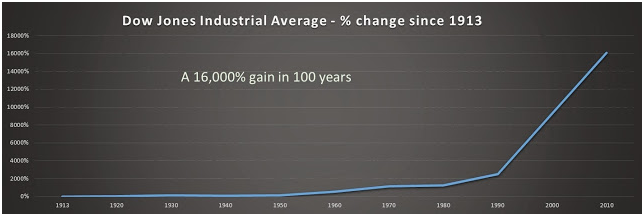
Here is USA's most famous measurement of prices, the Dow Jones Industrial Average, from 1913 to 2010, measuring its percentage change.
A 7 year average price is the first point in 1913. A 7 year average price is the second point, ending 1920. Then 10 year average prices after that.

In 2009, scouring stock graphs, I saw a strong inverse relationship, between the measure of the USA dollar and stock prices, especially from August 2008 to November 2008.
The following graphs show a measure of the dollar on the top (NYSE: UUP) and stocks on the bottom (NASDAQ) for 2008.

When I see an inverse relationship, I figure it is reasonable to assess a cause and an effect. The assessment that comes to me is: a weak dollar is the cause and higher prices are the effect. Observing the last century, I conclude the relationship is not a perfect match, 1 to 1. Still, I have to start with an assessment.
The first question I have: if the dollar had held the same level of purchasing power, since 1913, what would have happened to stock prices? To calculate this, multiply stock prices of today, by what's left of $1.
$10,000 represents the approximate average price of the Dow from 2000 to 2010; $0.04 represents what's left of $1.00 since 1913.
10,000 times 0.04 is 400.
Does this mean, if, and only if, the dollar had held its same purchasing power since 1913, the Dow would have only gotten to around $400?
To check an assessment I search for matches.
This first assessment says, the Dow is an accurate measure of 2 things:
1: inflation.
2: value.
In the early 1900s, the Dow was around 100.
If the dollar's value had been constant, there had been no inflation, the Dow's price would only have grown from around 100 to 400, from around 1900 to 2000.
Growth of 4 times.
What matches this growth rate?
What was the population of USA in 1900 compared to 2000?
Roughly, population went from around 75 to 300 million.
Growth of 4 times.
With a match confirmed, I arrive at the conclusion: in regards to aggregate changes in stock prices in the past, and the belief in aggregate changes in stock prices in the future: the aggregate changes in stock prices in the future, will align to the past changes, in the value of all people.
Expressed simply: STOCKS = PERSON.
So, multiply the average Dow prices, by the amount that $1.00 eroded to at each plotted point to adjust for inflation.
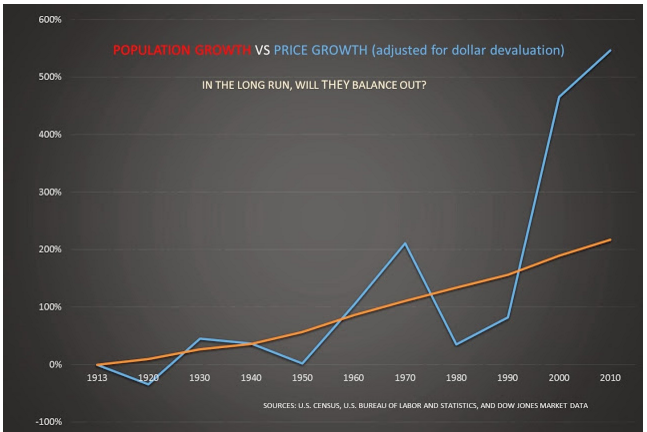
Then translate the changes to percentage amounts. Reflecting changes by a degree of percentage shows the graph in clearer perspective.

At first, drastic deviations in stock prices from population appear to confound the conclusion. I maintain the belief, that this is a sound expectation, and, though the last 100+ years have been greatly off track, prices and population will eventually align to each other.
Over 10 year intervals, the increases and decreases of prices show as severe, and have drifted far greater or far lesser than population; but prices have eventually been pulled to population. The volatile graph, I compare to perception, and the smooth graph, I compare to actuality. In spite of the volatility, I am certain of the belief: perception will align to actuality.
Now, I express the SHORT-TERM target I compute of the stock-market (our most popular measurement of asset prices).
Based on the last graph, population versus price, in 2010, the inflation adjusted price, over the population value, is near a ratio of 5/2: inflation adjusted prices grew 547% since 1913; and population grew 218% since 1913.
The ratio computes the average price of the DJIA from 2000 to 2010 (which is 10,471).
Considering the time being the middle of 2014, the DJIA is near 17,000;
the value of $1 is mostly steady, holding around 0.04 (considering a 1913 start at 1).
Population is a bit greater in 2014, versus 2010.
In the middle of 2014, since 1913, I compute, inflation adjusted prices have grown 950% and population has grown 228%.
I follow the Nasdaq more closely than the Dow, so I choose to shift to this broader index at this point, (but the Dow goes further back, and is similar to the Nasdaq, so was used as the initial basis for this thesis).
In the middle of 2014, the Nasdaq is near 4,400.
Solving for x:
950 / 228 = 4,400 / x
950 * x = 1,003,200
1,003,200 / 950 = 1056
Then, considering the purchasing power of the dollar:
excessive dollars, issued and demanded, caused a drop in 1 dollar’s purchasing power, from roughly 1 to 0.50, from 1913 to 1920;
by 1940, corrective actions had strengthened the dollar to near 0.70;
since then, excessive actions have caused the devaluation of the dollar to 0.04; I am guessing, corrective actions could eventually cause it to increase to 0.12 (an increase of 3 times);
side note: corrective actions involve collecting high risk debts, removing excess dollars from the marketplace;
again, solving for x:
12 / 4 = 1,056 / x
12 * x = 4,224
4224 / 12 = 352
So, if my belief becomes true, and, so to speak, perception (as in prices) can more closely align to actuality (as in population), Nasdaq might align to $352.
Using a Dow to Nasdaq ratio of 6, this calculates to Dow $2,112.
That this action will strengthen the dollar’s value from 0.04 to 0.12 I estimate by drawing a typical trend line.
Why should the dollar become strong at this point? Graphs with decelerating losses generally reach a point where they flat line. I believe there will be a nice increase, as the trend levels out.
The dollar currently appears to me as being at a critical inflection point. In all of 2014 it showed strength.
At the end of 2014, it seemed to me as being clear, the major question was not: will the dollar have a major increase in value (when junk loans go sour); but when will this major increase be complete?
In Dec. 2016 the dollar is near the high point it set in 2014; and stocks continue to set all time highs, with the Dow eyeing 20,000.
Just in case anyone hasn't heard of the PPT, here is a wiki:
en.wikipedia.org...
I'm not really trying to start a discussion about what the PPT does, I just thought it was a catchy title for my first new thread posted on ATS.
I am trying to show why the stock market should plunge, using 4 simple charts, and basic algebra.
I open with a graph, using data from the USA Bureau of Labor Statistics.
It shows buying power of the USA dollar since 1913. It shows a 7 year interval, from 1913 to 1920, then after that 10 year intervals.

Here is USA's most famous measurement of prices, the Dow Jones Industrial Average, from 1913 to 2010, measuring its percentage change.
A 7 year average price is the first point in 1913. A 7 year average price is the second point, ending 1920. Then 10 year average prices after that.

In 2009, scouring stock graphs, I saw a strong inverse relationship, between the measure of the USA dollar and stock prices, especially from August 2008 to November 2008.
The following graphs show a measure of the dollar on the top (NYSE: UUP) and stocks on the bottom (NASDAQ) for 2008.

When I see an inverse relationship, I figure it is reasonable to assess a cause and an effect. The assessment that comes to me is: a weak dollar is the cause and higher prices are the effect. Observing the last century, I conclude the relationship is not a perfect match, 1 to 1. Still, I have to start with an assessment.
The first question I have: if the dollar had held the same level of purchasing power, since 1913, what would have happened to stock prices? To calculate this, multiply stock prices of today, by what's left of $1.
$10,000 represents the approximate average price of the Dow from 2000 to 2010; $0.04 represents what's left of $1.00 since 1913.
10,000 times 0.04 is 400.
Does this mean, if, and only if, the dollar had held its same purchasing power since 1913, the Dow would have only gotten to around $400?
To check an assessment I search for matches.
This first assessment says, the Dow is an accurate measure of 2 things:
1: inflation.
2: value.
In the early 1900s, the Dow was around 100.
If the dollar's value had been constant, there had been no inflation, the Dow's price would only have grown from around 100 to 400, from around 1900 to 2000.
Growth of 4 times.
What matches this growth rate?
What was the population of USA in 1900 compared to 2000?
Roughly, population went from around 75 to 300 million.
Growth of 4 times.
With a match confirmed, I arrive at the conclusion: in regards to aggregate changes in stock prices in the past, and the belief in aggregate changes in stock prices in the future: the aggregate changes in stock prices in the future, will align to the past changes, in the value of all people.
Expressed simply: STOCKS = PERSON.
So, multiply the average Dow prices, by the amount that $1.00 eroded to at each plotted point to adjust for inflation.
Then translate the changes to percentage amounts. Reflecting changes by a degree of percentage shows the graph in clearer perspective.

At first, drastic deviations in stock prices from population appear to confound the conclusion. I maintain the belief, that this is a sound expectation, and, though the last 100+ years have been greatly off track, prices and population will eventually align to each other.
Over 10 year intervals, the increases and decreases of prices show as severe, and have drifted far greater or far lesser than population; but prices have eventually been pulled to population. The volatile graph, I compare to perception, and the smooth graph, I compare to actuality. In spite of the volatility, I am certain of the belief: perception will align to actuality.
Now, I express the SHORT-TERM target I compute of the stock-market (our most popular measurement of asset prices).
Based on the last graph, population versus price, in 2010, the inflation adjusted price, over the population value, is near a ratio of 5/2: inflation adjusted prices grew 547% since 1913; and population grew 218% since 1913.
The ratio computes the average price of the DJIA from 2000 to 2010 (which is 10,471).
Considering the time being the middle of 2014, the DJIA is near 17,000;
the value of $1 is mostly steady, holding around 0.04 (considering a 1913 start at 1).
Population is a bit greater in 2014, versus 2010.
In the middle of 2014, since 1913, I compute, inflation adjusted prices have grown 950% and population has grown 228%.
I follow the Nasdaq more closely than the Dow, so I choose to shift to this broader index at this point, (but the Dow goes further back, and is similar to the Nasdaq, so was used as the initial basis for this thesis).
In the middle of 2014, the Nasdaq is near 4,400.
Solving for x:
950 / 228 = 4,400 / x
950 * x = 1,003,200
1,003,200 / 950 = 1056
Then, considering the purchasing power of the dollar:
excessive dollars, issued and demanded, caused a drop in 1 dollar’s purchasing power, from roughly 1 to 0.50, from 1913 to 1920;
by 1940, corrective actions had strengthened the dollar to near 0.70;
since then, excessive actions have caused the devaluation of the dollar to 0.04; I am guessing, corrective actions could eventually cause it to increase to 0.12 (an increase of 3 times);
side note: corrective actions involve collecting high risk debts, removing excess dollars from the marketplace;
again, solving for x:
12 / 4 = 1,056 / x
12 * x = 4,224
4224 / 12 = 352
So, if my belief becomes true, and, so to speak, perception (as in prices) can more closely align to actuality (as in population), Nasdaq might align to $352.
Using a Dow to Nasdaq ratio of 6, this calculates to Dow $2,112.
That this action will strengthen the dollar’s value from 0.04 to 0.12 I estimate by drawing a typical trend line.
Why should the dollar become strong at this point? Graphs with decelerating losses generally reach a point where they flat line. I believe there will be a nice increase, as the trend levels out.
The dollar currently appears to me as being at a critical inflection point. In all of 2014 it showed strength.
At the end of 2014, it seemed to me as being clear, the major question was not: will the dollar have a major increase in value (when junk loans go sour); but when will this major increase be complete?
In Dec. 2016 the dollar is near the high point it set in 2014; and stocks continue to set all time highs, with the Dow eyeing 20,000.
The market is being inflated heavily right before a massive correction.
The market going so high isn't good.
The market going so high isn't good.
originally posted by: Darkmadness
The market is being inflated heavily right before a massive correction.
The market going so high isn't good.
Hasn't the stock market been heavily inflated for its entire history?
Hot air balloon economics. The next deflation will be bad for everyone- Here's hoping I'm out of the city by then.
Does your calculations account for the increase of USD in circilation by 300% since 2000. All things being equal this should have caused a 300%
collapse in the wealth of USD.


edit on 7-12-2016 by glend because: (no reason given)
The markets are front run by NSA supercomputers with unlimited funds to ensure theres always a buyer for whatever crap gets dumped the only
corrections you'll ever see are allowed ones.PPT is pre-2008 the rabbit hole goes much deeper now.
originally posted by: khnum
The markets are front run by NSA supercomputers with unlimited funds to ensure theres always a buyer for whatever crap gets dumped the only corrections you'll ever see are allowed ones.PPT is pre-2008 the rabbit hole goes much deeper now.
Sounds like someone fell in the rabbit hole all the way to the bottom....
Source ?
Do You Believe In The Plunge Protection Team?
Its worked , what twice?(actually more)
PPT comes right out of the Constitution of the United States ..."..to ensure domestic tranquility...etc.."
Recall the six goals mentioned in the preamble: UNION, JUSTICE, TRANQUILITY, DEFENCE, WELFARE, LIBERTY.
These things require an operational and effective PPT.
So, it's mandated by the supreme law of the land.
Recall the six goals mentioned in the preamble: UNION, JUSTICE, TRANQUILITY, DEFENCE, WELFARE, LIBERTY.
These things require an operational and effective PPT.
So, it's mandated by the supreme law of the land.
originally posted by: lordcomac
Hot air balloon economics. The next deflation will be bad for everyone- Here's hoping I'm out of the city by then.
As companies have expanded their geographic reach, those operating in big cities have come to not produce much, but just move already made products around, or provide a service that is not a product. The ratio is like 80% service and 20% production. This may be due to efficiency improvements in production technologies, causing less need for production manpower. But the improvements in technology haven't eliminated the need to find a job to get paid.
Anyway, the point is it takes relatively few people to produce the goods needed to sustain all people.
So why should a stock market correction make you want to get out of the city? Wouldn't we still have all the goods we need to sustain all people?
Its not like a stock certificate is a good, is it?
originally posted by: glend
Does your calculations account for the increase of USD in circilation by 300% since 2000. All things being equal this should have caused a 300% collapse in the wealth of USD.
As far as I know, the most you can collapse is 100%.
Of course you can grow by more than 100%.
There has been inflation since 2000; my rent has doubled since then. Similar for home prices, since 2000.
Recently, USD has gotten stronger, relative to other currencies, since 2014. This seems like a deflationary signal to me.
originally posted by: khnum
The markets are front run by NSA supercomputers with unlimited funds to ensure theres always a buyer for whatever crap gets dumped the only corrections you'll ever see are allowed ones.PPT is pre-2008 the rabbit hole goes much deeper now.
Why should the NSA care about stock prices? Are stock certificates a good?
a reply to: InachMarbank
Is the financial security of a country and its currency a national security issue?
Snowden interviews suggest it is.
Is the financial security of a country and its currency a national security issue?
Snowden interviews suggest it is.
edit on 7-12-2016 by khnum because: (no reason given)
originally posted by: AMPTAH
PPT comes right out of the Constitution of the United States ..."..to ensure domestic tranquility...etc.."
Recall the six goals mentioned in the preamble: UNION, JUSTICE, TRANQUILITY, DEFENCE, WELFARE, LIBERTY.
These things require an operational and effective PPT.
So, it's mandated by the supreme law of the land.
You're joking right?
originally posted by: khnum
a reply to: InachMarbank
Is the financial security of a country and its currency a national security issue?
Snowden interviews suggest it is.
What do you mean by financial security of a country and its currency? How do you define this?
a reply to: InachMarbank
Ill give you an example if someone say Russia was to send a cyberpacket to destroy Wall Street to stop it you would have to monitor banks and Wall Street in real time,which they do among many other things.
Ill give you an example if someone say Russia was to send a cyberpacket to destroy Wall Street to stop it you would have to monitor banks and Wall Street in real time,which they do among many other things.
originally posted by: InachMarbank
You're joking right?
Say you've sworn to uphold the constitution.
And the stock market is about to crash.
You know that if it crashes, massive wealth will be wiped out, banks will fail, corporations will shut down,
and people will take to the streets to riot and protest. Unrest will spread all across the land.
What would you do?
Remember again, You've sworn to uphold the constitution.
If there's action that you can take to maintain national "tranquility" and the people's "welfare" you must take that action, because you've sworn to protect these things.
So, you press the PPT button, and viola, the stock market fall is halted.
By putting a "floor" on how low the stocks can fall, you maintain the SIX principles in the Constitution.
new topics
-
Democrats send letter to Biden urging him to ratify Equal Rights Amendment
US Political Madness: 4 hours ago
top topics
-
Reprehensible Behavior
US Political Madness: 16 hours ago, 11 flags -
This is adorable you guys!
General Chit Chat: 15 hours ago, 9 flags -
Defending the need for adherence to Old Testament commandments under the new covenant of Christ
Conspiracies in Religions: 17 hours ago, 5 flags -
Democrats send letter to Biden urging him to ratify Equal Rights Amendment
US Political Madness: 4 hours ago, 2 flags
active topics
-
-@TH3WH17ERABB17- -Q- ---TIME TO SHOW THE WORLD--- -Part- --44--
Dissecting Disinformation • 3714 • : brewtiger123 -
Only two Navy destroyers currently operational as fleet size hits record low
Military Projects • 24 • : Freeborn -
Defending the need for adherence to Old Testament commandments under the new covenant of Christ
Conspiracies in Religions • 27 • : FlyersFan -
Those Fake Death Numbers From Hamas Out Of Gaza
Middle East Issues • 193 • : FlyersFan -
Rant. I am sick of people saying the police are revenue raising.
Rant • 13 • : PorkChop96 -
Light from Space Might Be Travelling Instantaneously
Space Exploration • 28 • : Lazy88 -
More Bad News for Labour and Rachel Reeves Stole Christmas from Working Families
Regional Politics • 9 • : covent -
Democrats send letter to Biden urging him to ratify Equal Rights Amendment
US Political Madness • 2 • : VariedcodeSole -
Post A Funny (T&C Friendly) Pic Part IV: The LOL awakens!
General Chit Chat • 7914 • : Cymru -
George Stephanopoulos and ABC agree to pay $15 million to settle Trump defamation suit
Mainstream News • 25 • : Echo007
