It looks like you're using an Ad Blocker.
Please white-list or disable AboveTopSecret.com in your ad-blocking tool.
Thank you.
Some features of ATS will be disabled while you continue to use an ad-blocker.
share:
I combined these three data sets to come up with this comparison.
www.eia.gov...
www.eia.gov...
www.eia.gov...
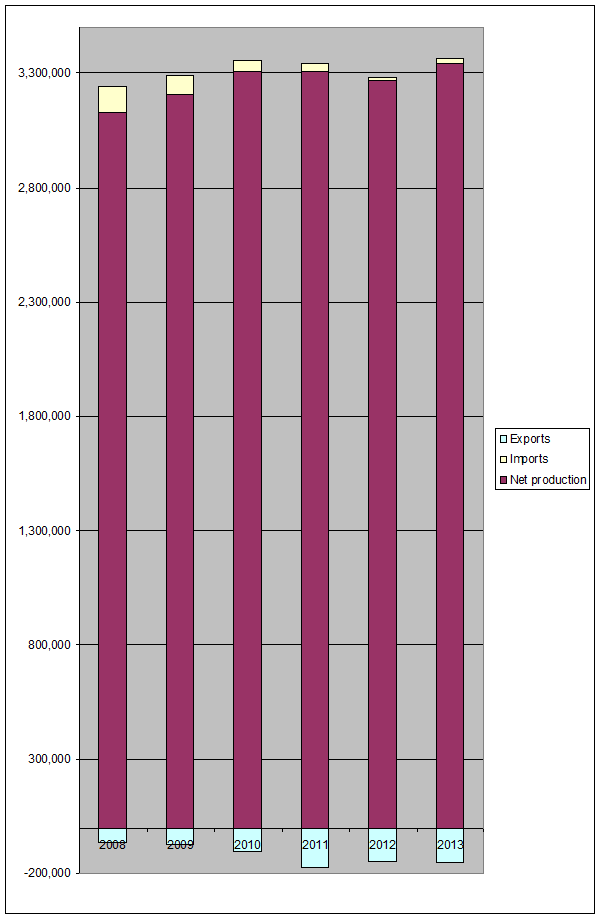
www.eia.gov...
www.eia.gov...
www.eia.gov...

originally posted by: Zanti Misfit
a reply to: Bassago
Gas on Average here in N.J. is around $4.45 a Gallon Right Now . Tourism is on a Down Trend so far this Summer of 2014 , and the Numbers of people who Usually take a Summer Vacation here are Showing to be Lower than Exspected . People are Driving Less , and this News just Confirms it . Drive Less , Pay More >? WTF !
Good point, the same probably goes for other petrol/gasoline uses. BTW, don't consider diesel, because the hatchet man is already there, or rather here in the EU. There is no current diesel road vehicle that will meet upcoming Euro standards for emissions, and going by press reports, not likely to be?? All sorts of funny wonders going on then.
www.businessgreen.com...
That link is local but the UN are no doubt the instigators. Not that I prefer diesels I don't, they are obviously in your face stinky and dirty, and always were, so no surprises there as regards health. It's a different kind of rat I smell.
Are you seeing 75% less cars on the road? I don't know about where you live, but I'm sure as hell not. Common sense would dictate that has to be
wrong.
a reply to: largo
not true...A barrel of oil makes x amount of gas,xx amount of diesel,xxx heating oil,y grease,so on. There is no way to make it all heating oil,diesel,or gasoline.A barrel makes about 20 different oil based products,and no way to make just heating oil
not true...A barrel of oil makes x amount of gas,xx amount of diesel,xxx heating oil,y grease,so on. There is no way to make it all heating oil,diesel,or gasoline.A barrel makes about 20 different oil based products,and no way to make just heating oil
originally posted by: pirhanna
originally posted by: CB328
I am calling BS on this, though no doubt there are plenty of people cutting back. I know that in the last decade there have been quite a few people moving to high gas-mileage cars, but I still see huge trucks everywhere, so I can't believe that gas usage has dropped significantly.
Chart isn't talking about US consumption. That's refinery production, which is down, as several refineries have gone offline for various reasons, from being too old to hurricane destruction. That just means more gasoline is being imported from foreign refineries, and / or less gasoline is being exported by US refineries.
There is not any real reduction in consumption.
^^ What Pirhanna said...
Refinery production =/= consumption.
Here's a link of "Finished Motor Gasoline" supplied.
LINK for Supply (gasoline)
Again, production and consumption don't always HAVE to add up if you are only accounting for domestic production - as Pirhanna has already pointed out.
You want a better indication of economic stability watch commodity price fluctuations.
Babyboomers are retiring at an increasing rate therefore less commuting,at the same time their positions are not being filled.
Its possible, in 1995 there no windmills, or solar plants, fewer solar panels and all the cars and semitrucks and delivery trucks got worse
mileage.
Today, more people can work from home, and more people ride bicycles. One stop Wal-Mart shopping or even on-line shopping delivered. Almost all work place forklifts are electric now, airliners get better mileage too. Appliances are more energy efficient.
Lower gasoline consumption also fits well with high unemployment, and under employment.
That said, the difference could be bogus and mostly a matter of how the data was handled.
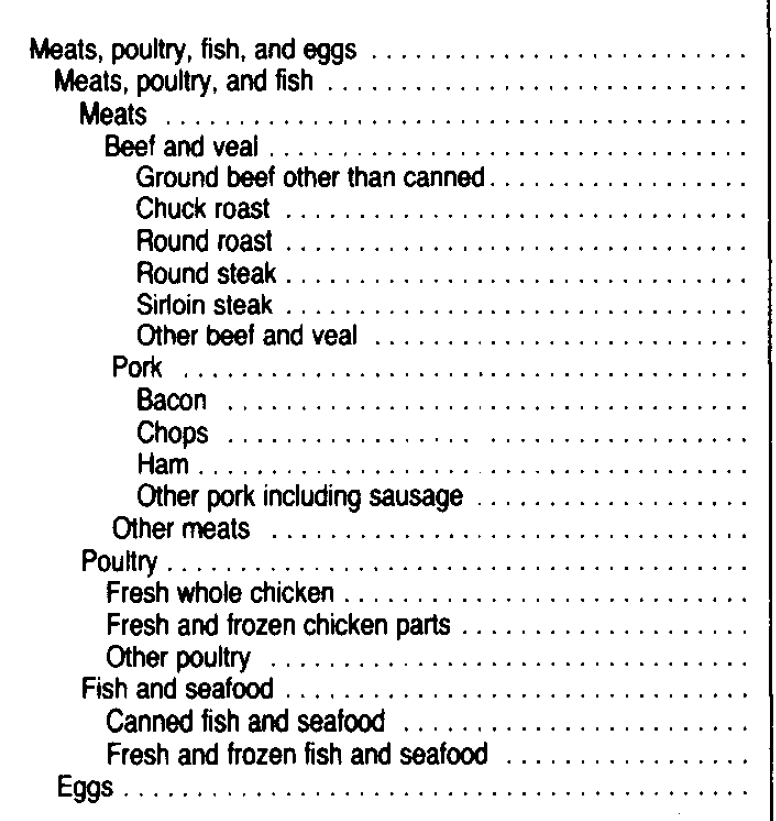
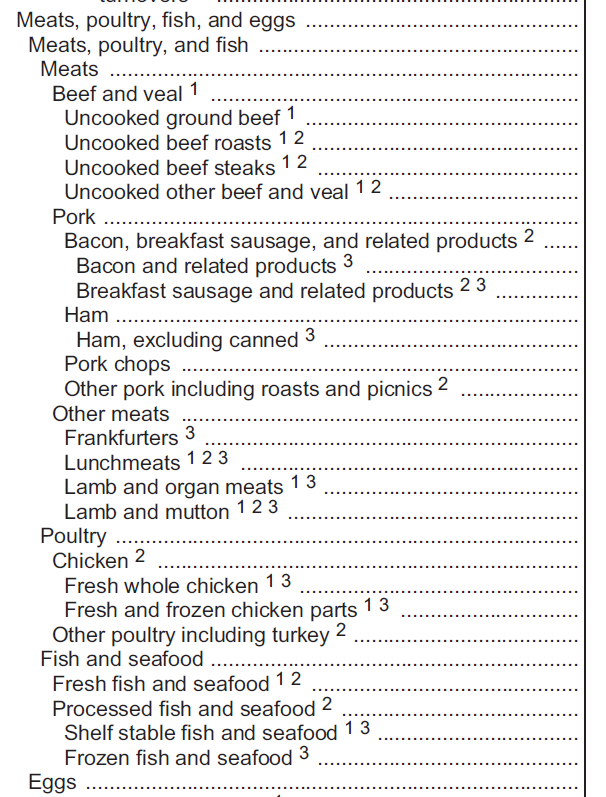
For example, the stuff in the Consumer Price Index, a list of goods who's prices are watched to see if prices are going up, gets changed to cheaper stuff when the price goes to high. They changed steak to roast to hamburger to meat, so they could say that inflation was 4% or lower. The CPI inflation is always lower than the real inflation.
Why the CPI is Controversial
CPI Basket Items '72-73 to 82-84 published 1987
CPI Basket Items 2013
Many items have come down in price, absolutely and adjusted for inflation, over time.
However, inflation, as a rule, takes all of the slack out of the benefits of improved production.
Money velocity is a measure how long until every dollar gets spent.
The money velocity looks about right considering how much money the Fed has made and how little there is to spend it on. The Fed-made money goes to bankster accounts, or the stock market, and just sits there.
That money never gets spent and so the money velocity is low.
Today, more people can work from home, and more people ride bicycles. One stop Wal-Mart shopping or even on-line shopping delivered. Almost all work place forklifts are electric now, airliners get better mileage too. Appliances are more energy efficient.
Lower gasoline consumption also fits well with high unemployment, and under employment.
That said, the difference could be bogus and mostly a matter of how the data was handled.
For example, the stuff in the Consumer Price Index, a list of goods who's prices are watched to see if prices are going up, gets changed to cheaper stuff when the price goes to high. They changed steak to roast to hamburger to meat, so they could say that inflation was 4% or lower. The CPI inflation is always lower than the real inflation.
... over time, the U.S. Congress embraced the view that the CPI should reflect changes in the cost to maintain a constant standard of living. Consequently, the CPI has been moving toward becoming a cost of living index (COLI).
Over the years, the methodology used to calculate the CPI has also undergone numerous revisions. According to the BLS, the changes removed biases that caused the CPI to overstate the inflation rate. The new methodology takes into account changes in the quality of goods and substitution. Substitution, the change in purchases by consumers in response to price changes, changes the relative weighting of the goods in the basket. The overall result tends to be a lower CPI. However, critics view the methodological changes and the switch from a COGI to a COLI focus as a purposeful manipulation that allows the U.S. government to report a lower CPI.
Why the CPI is Controversial
CPI Basket Items '72-73 to 82-84 published 1987

CPI Basket Items 2013

Many items have come down in price, absolutely and adjusted for inflation, over time.
However, inflation, as a rule, takes all of the slack out of the benefits of improved production.
Money velocity is a measure how long until every dollar gets spent.
The money velocity looks about right considering how much money the Fed has made and how little there is to spend it on. The Fed-made money goes to bankster accounts, or the stock market, and just sits there.
That money never gets spent and so the money velocity is low.
edit on 1-6-2014 by Semicollegiate because: (no reason given)
edit on 1-6-2014 by Semicollegiate because: ADDED LISTS
a reply to: Bassago
I suspect it is actually closer to the truth than we want to admit. Recreational driving is dead.
Upon reading the article though, it emphatically states that consumption at the pump is NOT what is being measured. Rather, gasoline leaving the refineries is being SUBSTITUTED for consumption at the pump. The article goes on to say that the only way to hide this information any further follows...
The party is over!
I suspect it is actually closer to the truth than we want to admit. Recreational driving is dead.
Upon reading the article though, it emphatically states that consumption at the pump is NOT what is being measured. Rather, gasoline leaving the refineries is being SUBSTITUTED for consumption at the pump. The article goes on to say that the only way to hide this information any further follows...
But what the liars-with-numbers cannot hide (any longer) is the collapse in U.S. gasoline consumption which has accompanied the continued, downward spiral of the Greater Depression. The storage tanks are now all full. The only way to (temporarily) hide the collapse in U.S. gasoline consumption any further would be to construct even more storage facilities. However, there is no possible economic justification for increasing storage capacity in a market of steadily/relentlessly declining demand.
The party is over!
If the discrepancy is because we have stopped importing as much oil,
then there is plenty of oil in storage so we don't need anymore
or there is no oil in storage and the next price jump will go straight to the pump-- $5 to $10 per gallon.
then there is plenty of oil in storage so we don't need anymore
or there is no oil in storage and the next price jump will go straight to the pump-- $5 to $10 per gallon.
a reply to: Grimpachi
More people living in fewer dwellings would reduce the amount of heating oil used and diesel also when used to generate electricity. February is the slowest month of the year for trucking. Often lower than half the normal loads and miles.
TPTB know that we are losing our ambition and incomes, from this statistic.
Consumption of distillate fuel, the category that includes diesel and heating oil, slipped 3.6 percent to 3.83 million barrels a day last month, the least for February since 2002.
More people living in fewer dwellings would reduce the amount of heating oil used and diesel also when used to generate electricity. February is the slowest month of the year for trucking. Often lower than half the normal loads and miles.
TPTB know that we are losing our ambition and incomes, from this statistic.
edit on 1-6-2014 by Semicollegiate because: (no reason given)
a reply to: snarky412
Each chart measures a different part of the chain of logistics. Bassago's chart is derived from imports(purchases), which happen before sales and can give a faster appraisal of the situation. Grimpachi's chart is derived from deliveries(sales).
Both charts show a downward trend.
Also explains why the chart you posted varies from the one grimpachi posted
Each chart measures a different part of the chain of logistics. Bassago's chart is derived from imports(purchases), which happen before sales and can give a faster appraisal of the situation. Grimpachi's chart is derived from deliveries(sales).
Both charts show a downward trend.
a reply to: wantsome
The cost of everything goes up because the Fed is paying for bigger government by printing more money. That was the reason for the housing bubble. There was easy credit because the Fed was printing more and more money so the interest rates were low.
But the economy was the same. Except that there was more money.
That's why the price of gas went up. Because there was more money for the same amount of stuff.
The graph shows the decline started in 2005. That's right around the time the price of gas exploded. It went from $2 a gallon to $4 a gallon practically over night. I believe the price of gas is the cause of the economic downturn that started hit in 2008.
The cost of everything goes up because the Fed is paying for bigger government by printing more money. That was the reason for the housing bubble. There was easy credit because the Fed was printing more and more money so the interest rates were low.
But the economy was the same. Except that there was more money.
That's why the price of gas went up. Because there was more money for the same amount of stuff.
originally posted by: NihilistSanta
a reply to: Bassago
That or they are hoarding fuel reserves in anticipation of a conflict. Perhaps a conflict large enough to interrupt fuel imports here? I am considering this from the angle of even though they want to implode the U.S. They still need to have the resources to maintain control of the territory and territories abroad.
Hoarding for a crisis is a definite possibility.
In the Retail Transportation sector there is a new paradigm. "Just in Time Delivery" The idea is to move products from the factory onto the shelf as fast as they can be sold. Stuff that doesn't sell here gets taken to someplace that buys more of that. Anyway, there are no warehouses like there used to be.
There used to be a middle man. A guy bought stuff from say Sony in Japan or at the dock, put it in a warehouse, and sold it for the best price he could get. The side effect of that was stockpiles of everything in big cities. Now stuff gets bought at the producer, as it is sold at the retailer. Cuts out all of the middle men and storage costs. There are no more stockpiles of stuff.
Applying that to fuel, its possible that there is no stockpile of gas. All of the gas gets used as it comes out of the ground. The imports dropped because we had a surplus and now that is getting used up.
a reply to: Wrabbit2000
Daytime traffic is surprisingly thick during normal work hours. Like all of the unemployed folks are out driving in the daytime. If you want to keep an even speed, to get good mileage, you have to drive at night or drive 57 mph.
The duration of rush hour might be a good guide to anyone who wants to measure it. There will always be stop and go traffic during rush hour, but rush hour will get shorter if fewer people are driving.
That being said? The numbers here don't make much sense and I'd want to ask truckers if they are seeing this kind of drop off of traffic. Rush hours and general traffic in the cities should be remarkably down to see the gas consumption drop like that. Truckers may see half a dozen of America's biggest cities (or more) in one week. So.. Is it down, drivers?
Daytime traffic is surprisingly thick during normal work hours. Like all of the unemployed folks are out driving in the daytime. If you want to keep an even speed, to get good mileage, you have to drive at night or drive 57 mph.
The duration of rush hour might be a good guide to anyone who wants to measure it. There will always be stop and go traffic during rush hour, but rush hour will get shorter if fewer people are driving.
originally posted by: xuenchen
a reply to: pirhanna
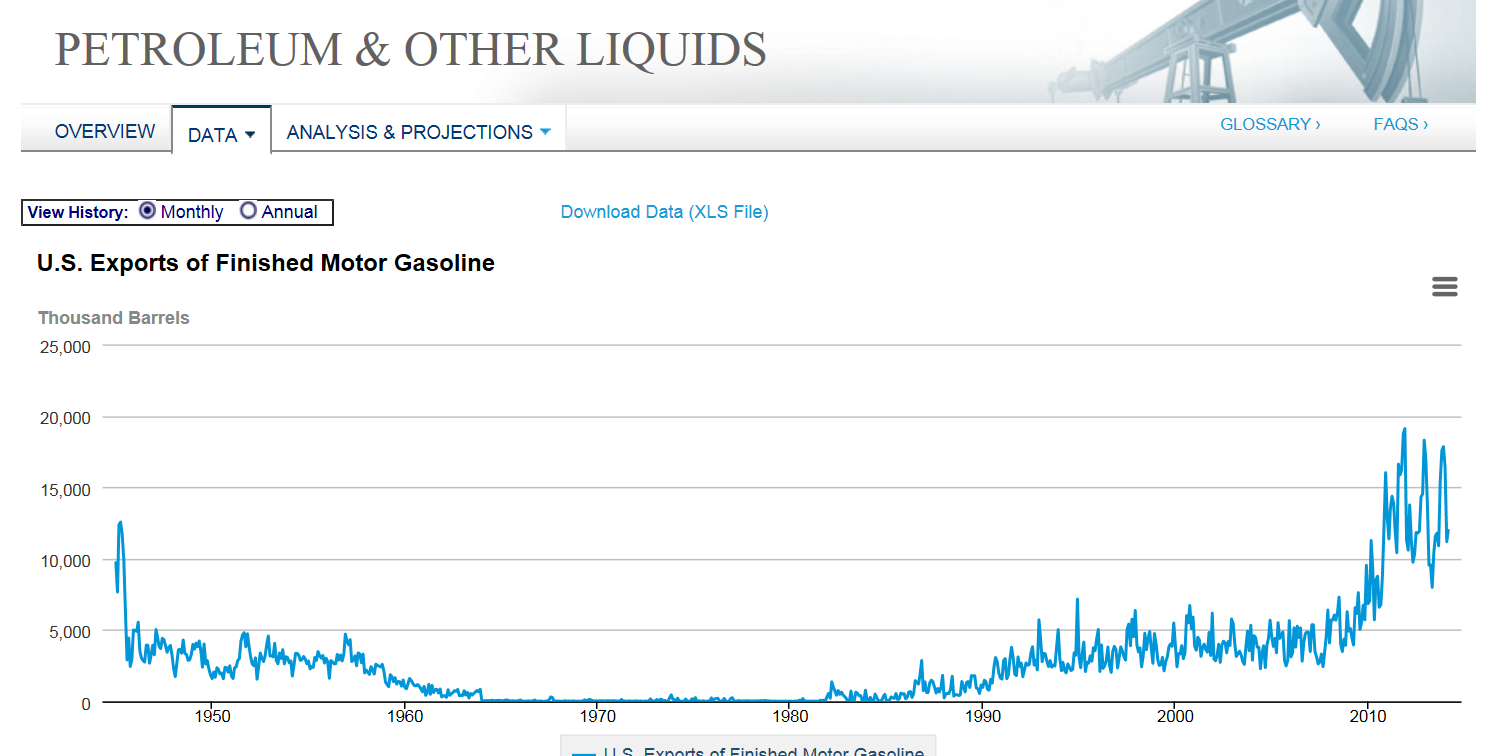
Somethings up for sure...
Weekly gasoline imports down
weekly exports up
very confusing.
Weekly Imports from EIA
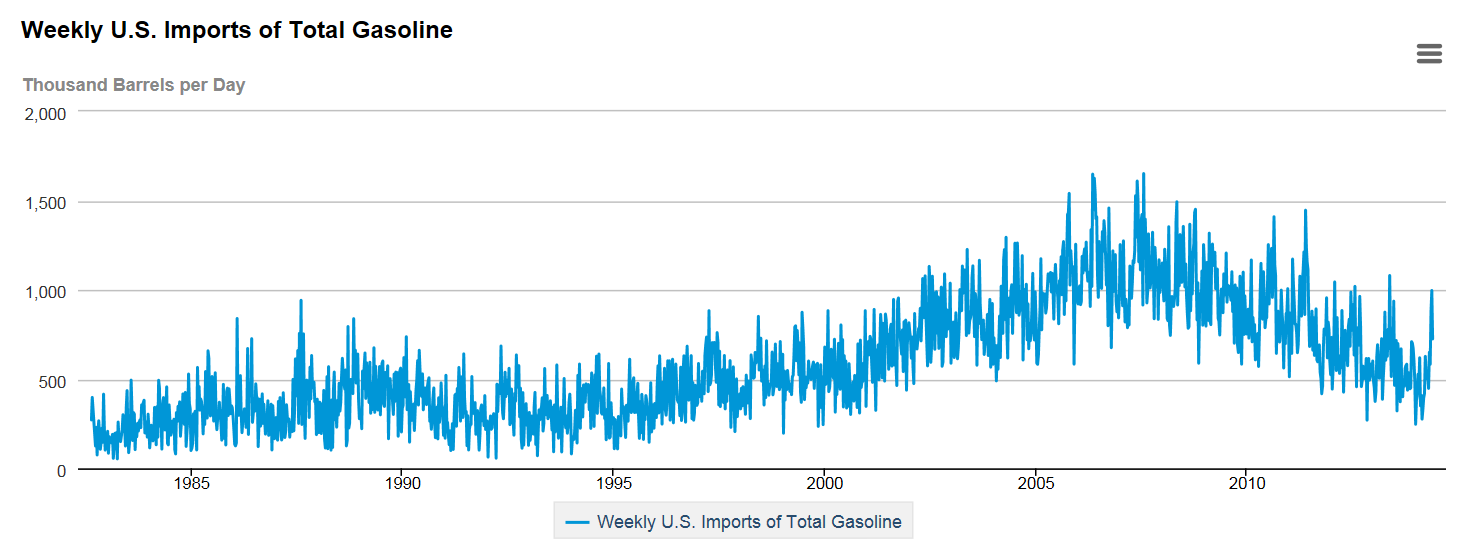
Weekly Exports from EIA
"Just in Time" logistics. Everything sold as soon as its viable. No stockpiles.
A quick look showed 160+ billion gal in 1999, 170+ billion gal in 2006 and 130+ billion gal in 2013, so yes we are using less gas. That 130 billion is
close to 1990 levels and I do not think the economy was all that bad.
A 20% less since 1999 not 75%. Add better buses taken off the gas consumption, better gas mileage, and less driving I would think these are reasonable numbers.
A 20% less since 1999 not 75%. Add better buses taken off the gas consumption, better gas mileage, and less driving I would think these are reasonable numbers.
edit on 2-6-2014 by Xtrozero because: (no reason given)
originally posted by: th3dudeabides
a reply to: Bassago
I suspect it is actually closer to the truth than we want to admit. Recreational driving is dead.
Upon reading the article though, it emphatically states that consumption at the pump is NOT what is being measured. Rather, gasoline leaving the refineries is being SUBSTITUTED for consumption at the pump. The article goes on to say that the only way to hide this information any further follows...
But what the liars-with-numbers cannot hide (any longer) is the collapse in U.S. gasoline consumption which has accompanied the continued, downward spiral of the Greater Depression. The storage tanks are now all full. The only way to (temporarily) hide the collapse in U.S. gasoline consumption any further would be to construct even more storage facilities. However, there is no possible economic justification for increasing storage capacity in a market of steadily/relentlessly declining demand.
This is my suspicion as well. In the past families would take Sunday drive just to go look at the countryside, planning a weekend jaunt just for fun out of state was common and going on a "road trip" was normal. Not anymore or it has been severely curtailed anyway.
I didn't see it mentioned (or missed it) when pump sales and consumption was change to this new method or if it was always that way. I'll take a WAG and say maybe when gasoline jumped above $2 a gallon. Just hazarding a guess though.
You are absolutely right in regard to the party being over though. It's sad for this generation.
a reply to: th3dudeabides
No. The chart they are showing is for sales by refiners directly to consumers. It only indicates that refiners are selling less directly to consumers and more to middle men.
www.abovetopsecret.com...
There is no "collapse in consumption", there has been a change in the way gasoline is being marketed. There has been a 2% decline in vehicle miles since 2008. Can you figure out how those miles are being driven if there is a 75% drop in gasoline consumption?
Little change in production. Little change in imports/exports. Gasoline consumption has not collapsed.

Upon reading the article though, it emphatically states that consumption at the pump is NOT what is being measured. Rather, gasoline leaving the refineries is being SUBSTITUTED for consumption at the pump.
No. The chart they are showing is for sales by refiners directly to consumers. It only indicates that refiners are selling less directly to consumers and more to middle men.
www.abovetopsecret.com...
There is no "collapse in consumption", there has been a change in the way gasoline is being marketed. There has been a 2% decline in vehicle miles since 2008. Can you figure out how those miles are being driven if there is a 75% drop in gasoline consumption?
Little change in production. Little change in imports/exports. Gasoline consumption has not collapsed.

edit on 6/2/2014 by Phage because: (no reason given)
new topics
-
A Merry Christmas.
Other Current Events: 2 hours ago -
Cold Blooded Killers on Christmas!! GRRRRrrr!!
Pets: 9 hours ago
top topics
-
Cold Blooded Killers on Christmas!! GRRRRrrr!!
Pets: 9 hours ago, 9 flags -
Plane Crash Today --Azerbaijanian E190 passenger jet
Mainstream News: 14 hours ago, 6 flags -
A Merry Christmas.
Other Current Events: 2 hours ago, 1 flags
active topics
-
Cold Blooded Killers on Christmas!! GRRRRrrr!!
Pets • 11 • : charlest2 -
The Effects of Electric Fields and Plasma on Plant Growth
Science & Technology • 11 • : ChaoticOrder -
Plane Crash Today --Azerbaijanian E190 passenger jet
Mainstream News • 18 • : Springbok -
Mood Music Part VI
Music • 3765 • : BrucellaOrchitis -
It's Offical Now
US Political Madness • 17 • : Freeborn -
‘Something horrible’: Somerset pit reveals bronze age cannibalism
Ancient & Lost Civilizations • 23 • : BrucellaOrchitis -
A Merry Christmas.
Other Current Events • 3 • : Cloudbuster1 -
London Christmas Market BANS Word ‘Christmas’
Social Issues and Civil Unrest • 51 • : Naftalin -
-@TH3WH17ERABB17- -Q- ---TIME TO SHOW THE WORLD--- -Part- --44--
Dissecting Disinformation • 3814 • : brewtiger123 -
The clotting is not going away latest
Medical Issues & Conspiracies • 15 • : NoCorruptionAllowed
