It looks like you're using an Ad Blocker.
Please white-list or disable AboveTopSecret.com in your ad-blocking tool.
Thank you.
Some features of ATS will be disabled while you continue to use an ad-blocker.

Buoy off of coast of Chile in tsunami mode
page: 15
share:
National Data Buoy Center
Okay, I do not keep check of these things. I only check the quakes and buoy maps when they are brought to my attention, so I am hoping that this has a mundane explanation! I found this info on George Ure's Urban Survival site and decided to ask about it here. There are MANY knowledgeable folks on ATS that I am sure can give me a good answer!
He also gives a link to this:Telemetry Data
but it is literally in a foreign language as far as I am concerned!
So please, one of our resident quake and tsunami experts wanna come forward and soothe my worried brow??!!
Several quakes 5.0 and larger. Two off coast of Chile.
earthquake.usgs.gov...
earthquake.usgs.gov...
earthquake.usgs.gov...
Of course that was two and three days ago. USGS not showing any within last day, except for the first link.
earthquake.usgs.gov...
earthquake.usgs.gov...
earthquake.usgs.gov...
Of course that was two and three days ago. USGS not showing any within last day, except for the first link.
edit on 26-1-2012 by thehoneycomb
because: (no reason given)
reply to post by thehoneycomb
Ahhhh, thanks honeycomb! I checked the quake watch thread, but no one has posted these!
ETA: Oh. I see your edit now. Well, those probably don't have anything to do with this then...... will wait to see some more info!!
Ahhhh, thanks honeycomb! I checked the quake watch thread, but no one has posted these!
ETA: Oh. I see your edit now. Well, those probably don't have anything to do with this then...... will wait to see some more info!!
edit on
1/26/12 by jennybee35 because: (no reason given)
reply to post by jennybee35
There apparently was a 6.3 and Mexico on the 21st. I did not know that until I checked the USGS.
earthquake.usgs.gov...
There apparently was a 6.3 and Mexico on the 21st. I did not know that until I checked the USGS.
earthquake.usgs.gov...
reply to post by jennybee35
Sorry for the confusion. The first link was today.
2012 January 25 16:04:10 UTC
Sorry for the confusion. The first link was today.
2012 January 25 16:04:10 UTC
reply to post by thehoneycomb
Well, there are no tsunami watches or warnings, so maybe this is just a one-off occurrence!
Well, there are no tsunami watches or warnings, so maybe this is just a one-off occurrence!
reply to post by jennybee35
My apologies, I should have posted the map to show you where the quake was.
earthquake.usgs.gov...
It was the one out there in the pacific.
My apologies, I should have posted the map to show you where the quake was.
earthquake.usgs.gov...
It was the one out there in the pacific.
reply to post by ignorant_ape
Is the buoy no longer pulsing, signalling a buoy in tsunami event mode? Lemme check back and see.....
ETA: Still showing as in tsunami event mode!
Is the buoy no longer pulsing, signalling a buoy in tsunami event mode? Lemme check back and see.....
ETA: Still showing as in tsunami event mode!
edit on 1/26/12 by jennybee35 because: (no reason given)
reply to post by jennybee35
It is still and I am no expert by any means, but I think that the mid ocean ones wouldn't be signaled as easily as tsunamis tend to gain momentum as they get closer to land.
It is still and I am no expert by any means, but I think that the mid ocean ones wouldn't be signaled as easily as tsunamis tend to gain momentum as they get closer to land.
reply to post by jennybee35
Hi. This is a graph of the data from the buoy which I obtained from your link and dumped into Excel.
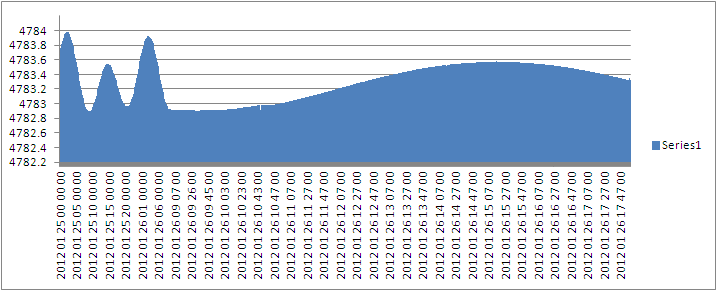
These are confusing graphs because 1 day is compacted into a very short space and then the current day is spread out. Note the very small 'nick' in the graph at around 10:45 today? This can also be seen on the graphs on this page
There does not appear to be any significant earthquake on the25th in the early hours with the last events for Chile being
I don't think any of those would have affected this buoy so long after the event and thus with that small nick i have to conclude a data drop out has triggered the alarm. This happens quite frequently.
The interpretation of the webicorder is completely wrong and that wave has nothing to do with magma! It is a malfunction as most of the LISS recorders have been off line. That looks to me like a calibration signal. but equally it is probably an error.
In the light of the higher solar activity at present problems like this are not surprising.
Hi. This is a graph of the data from the buoy which I obtained from your link and dumped into Excel.
These are confusing graphs because 1 day is compacted into a very short space and then the current day is spread out. Note the very small 'nick' in the graph at around 10:45 today? This can also be seen on the graphs on this page
There does not appear to be any significant earthquake on the25th in the early hours with the last events for Chile being
Date/Time UTC,Latitude,Longitude,Magnitude,Depth(Km),Location
2012-01-24 16:48:22, -41.234, -85.969, 4.9, 10.0, West Chile Rise
2012-01-24 01:45:27, -34.534, -71.886, 4.6, 34.0, Libertador General Bernardo O’Higgins. Chile
2012-01-23 21:55:14, -36.317, -73.123, 5.0, 20.4, Offshore Bio-Bio. Chile
2012-01-23 17:22:10, -36.343, -73.223, 4.9, 28.1, Offshore Bio-Bio. Chile
2012-01-23 16:04:54, -36.414, -73.015, 6.2, 29.7, Offshore Bio-Bio. Chile
2012-01-22 11:24:09, -28.681, -71.030, 5.0, 58.8, Atacama. Chile
2012-01-19 07:10:21, -31.614, -71.638, 4.8, 43.4, Offshore Coquimbo. Chile
I don't think any of those would have affected this buoy so long after the event and thus with that small nick i have to conclude a data drop out has triggered the alarm. This happens quite frequently.
The interpretation of the webicorder is completely wrong and that wave has nothing to do with magma! It is a malfunction as most of the LISS recorders have been off line. That looks to me like a calibration signal. but equally it is probably an error.
In the light of the higher solar activity at present problems like this are not surprising.
reply to post by PuterMan
Thank you, PuterMan!! I just knew there would be a good explanation from someone who knew what they were talking about. I guess the solar activity has probably caused a lot of off readings in various technical equipment.
Thank you, PuterMan!! I just knew there would be a good explanation from someone who knew what they were talking about. I guess the solar activity has probably caused a lot of off readings in various technical equipment.
new topics
-
FBI confirms new leads connected to DNA evidence and cellphone data in disturbing killings of elderl
Breaking Alternative News: 21 minutes ago -
Moyes No Longer Blowing Bubbles
World Sports: 29 minutes ago -
Breaking--Hamas Accepts New Cease Fire
Middle East Issues: 55 minutes ago -
Soros, Rockefeller and Pritzker, according to a POLITICO analysis Back Palestinian protests
US Political Madness: 1 hours ago -
Tornado Obliterates Nebraska Building with Furious Anger
Fragile Earth: 1 hours ago -
They say justice is blind.
Religion, Faith, And Theology: 1 hours ago -
Liberal Democrats to Table a Motion of No Confidence in the government Tomorrow
Regional Politics: 3 hours ago -
Time Traveler Caught on Camera?
Paranormal Studies: 3 hours ago -
Trump legal cases are falling apart at break neck speeds
US Political Madness: 4 hours ago -
We are screwed
Global Meltdown: 4 hours ago
top topics
-
Medvedev: “No one can hide, a global catastrophe is coming”
World War Three: 5 hours ago, 14 flags -
Trump legal cases are falling apart at break neck speeds
US Political Madness: 4 hours ago, 13 flags -
We are screwed
Global Meltdown: 4 hours ago, 11 flags -
Time Traveler Caught on Camera?
Paranormal Studies: 3 hours ago, 4 flags -
Soros, Rockefeller and Pritzker, according to a POLITICO analysis Back Palestinian protests
US Political Madness: 1 hours ago, 4 flags -
Messages of Hope – Unity through AI
Dreams & Predictions: 13 hours ago, 3 flags -
Liberal Democrats to Table a Motion of No Confidence in the government Tomorrow
Regional Politics: 3 hours ago, 3 flags -
Breaking--Hamas Accepts New Cease Fire
Middle East Issues: 55 minutes ago, 2 flags -
Tornado Obliterates Nebraska Building with Furious Anger
Fragile Earth: 1 hours ago, 2 flags -
Happy Cinco de mayo.
General Chit Chat: 14 hours ago, 2 flags
active topics
-
Candidate TRUMP Now Has Crazy Judge JUAN MERCHAN After Him - The Stormy Daniels Hush-Money Case.
Political Conspiracies • 1220 • : Oldcarpy2 -
Moyes No Longer Blowing Bubbles
World Sports • 1 • : gortex -
We are screwed
Global Meltdown • 8 • : BingoMcGoof -
Medvedev: “No one can hide, a global catastrophe is coming”
World War Three • 72 • : Oldcarpy2 -
-@TH3WH17ERABB17- -Q- ---TIME TO SHOW THE WORLD--- -Part- --44--
Dissecting Disinformation • 823 • : Thoughtful3 -
Zionists of ATS assemble
Political Issues • 182 • : Lazy88 -
The Dark Pyramid of Alaska and the Why Files take on the subject
Whistle Blowers and Leaked Documents • 22 • : AtomicBulldog -
Breaking--Hamas Accepts New Cease Fire
Middle East Issues • 18 • : KrustyKrab -
Time Traveler Caught on Camera?
Paranormal Studies • 20 • : CarlLaFong -
The BEAST System of Revelation has been awoken and has assumed control, at least since COVID.
New World Order • 14 • : Asktheanimals
5