It looks like you're using an Ad Blocker.
Please white-list or disable AboveTopSecret.com in your ad-blocking tool.
Thank you.
Some features of ATS will be disabled while you continue to use an ad-blocker.
share:
So this question was posed and I was curious as to the correct answer. There is no rush--I am merely curious and would especially like to understand
the equations in the link provided if any of you would be so kind as to explain some basics to me :3
If anyone could provide me with the correct answer to the question in the first picture, I will give you one whole cookie
Extra source (incl. the equations)


If anyone could provide me with the correct answer to the question in the first picture, I will give you one whole cookie
Extra source (incl. the equations)


edit on 16-3-2021 by rukia because:
edit on 16-3-2021 by rukia because: (no reason given)
a reply to: FamCore
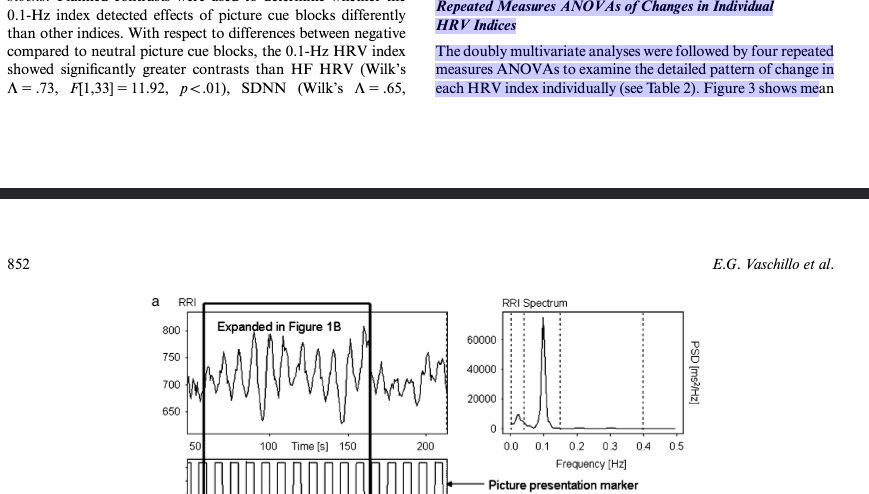
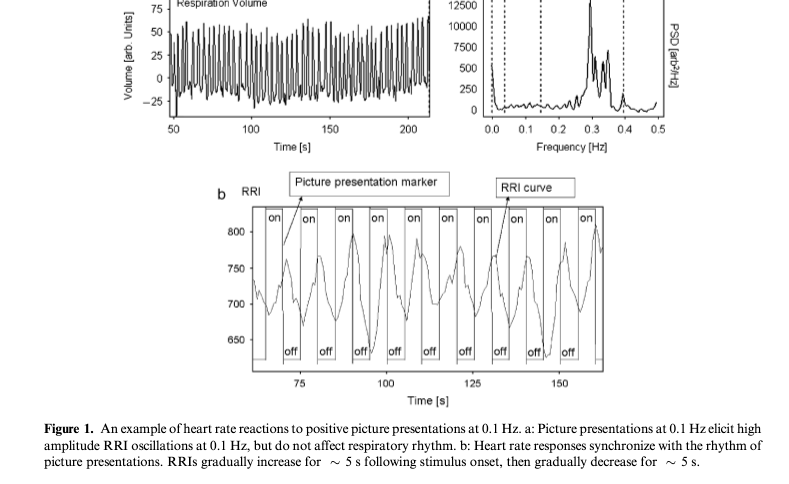
It's okay! We know the answer: Essentially the RRI in figure one emulates the increase reflected on the second figure at the RR spectral peak. As the for the second part of the answer, my fiance seems to know--but I am a bit lost. I literally took this class last semester and already these kids are learning new things! I'm just trying to keep on the up-and-up
Thank you for trying though. That was nice of you! It made my mind go numb at first until I remembered that I already learned this lol
But if anyone can help me understand those crazy equations in the link I would be grateful. Or point me in a direction as to where I could learn how to understand said equations about RR interval spectral analysis and those gosh darn ANOVAS lol. I hate them and love them
edit on
16-3-2021 by rukia because: (no reason given)
a reply to: FamCore
Oh [insert vulgar term here] I just realized you can't zoom in on the pictures! I am so sorry guys >.<
that is too funny, but I can understand and empathize with that critique. You are totally right dude!
Big ooooof for me!
For any interested, the name of the source is: Heart rate variability response to alcohol, placebo, and emotional picture cue challenges: Effects of 0.1-Hz stimulation
EVGENY G. VASCHILLO,aMARSHA E. BATES,a,bBRONYA VASCHILLO,aPAUL LEHRER,bTOMOKO UDO,aEUN YOUNG MUN,aandSUCHISMITA RAYaaCenter of Alcohol Studies, Rutgers, The State University of New Jersey, Piscataway, New Jersey, USAbDepartment of Psychiatry, University of Medicine and Dentistry of New Jersey, Robert Wood Johnson Medical School, Piscataway,New Jersey, USA
Abstract
Heart rate variability (HRV) supports emotion regulation and is reduced by alcohol. Based on the resonance propertiesof the cardiovascular system, a new 0.1-Hz methodology was developed to present emotional stimuli and assess HRVreaction in participants (N536) randomly assigned to an alcohol, placebo, or control condition. Blocked picture cues(negative, positive, neutral) were presented at a rate of 5 s on, 5 s off (i.e., 0.1-Hz frequency). SDNN, pNN50, and HFHRV were reduced by alcohol, compared to the placebo and control. The 0.1-Hz HRV index was diminished byalcohol and placebo, suggesting that autonomic regulation can be affected by cognitive expectancy. The 0.1-Hz HRVindex and pNN50 detected changes in arousal during emotional compared to neutral cues, and the 0.1-Hz HRV indexwas most sensitive to negative valence. The 0.1-Hz HRV methodology may be useful for studying the intersection ofcognition, emotion, and autonomic regulation.Descriptors:Alcohol, Placebo, Emotion, HRV, 0.1-Hz resonance, Baroreflex
edit on 16-3-2021 by rukia because: YIKES ON MANY BIKES MY PICTURES WERE SMOL
Looks like frequency responses and measurement of a square wave... Without really reading anything...
edit on 16-3-2021 by Xtrozero because: (no reason given)
a reply to: one4all
First of all--awesome name. My Hero Academia is such a great show
What would one build though?
WAIT A MINUTE!
I know: The Ventech Missile Defense System that was controlled by M.U.T.H.E.R.
SAUCE
...Go Team Venture!
To add: As Elon Musk stated, "There's a tremendous bias against taking risks. Everyone is trying to optimize their...covering."
edit on
16-3-2021 by rukia because: (no reason given)
FFT FTW


edit on 16-3-2021 by rukia because: (no reason given)
a reply to: Xtrozero
a reply to: Sookiechacha
To note, good sirs and/or madams, this is not just a reply to you but to the thread itself, to close it. Thank you for your analysis!
BEHOLD! THE ABRIDGED ANSWER TO THE QUESTION STATED IN THE OP
Also, the topic is Psychophysiology

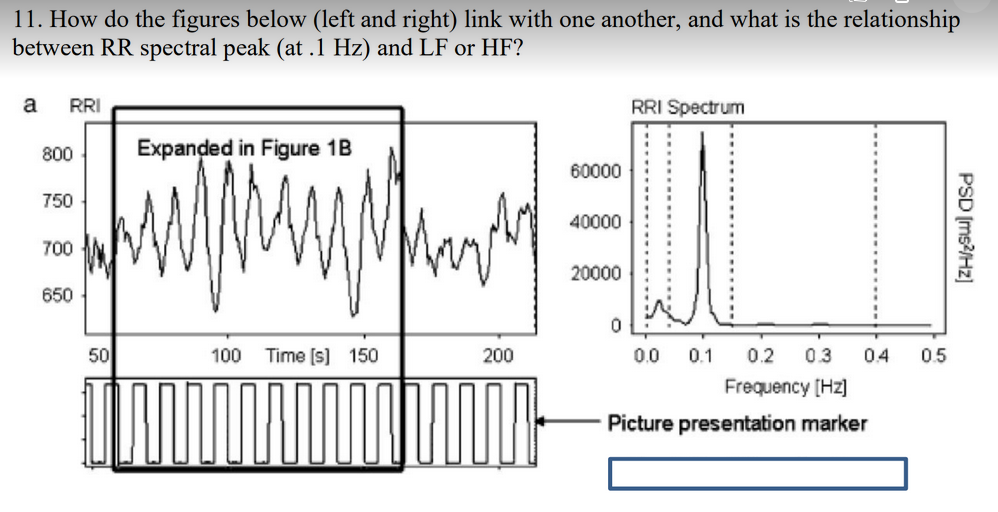
ANSWER: The figure on the left is essentially an uncompressed form of the figure on the right. The figure on the right is measured in Hertz (Hz) and is a potential indicator of emotional adjustment level, hence the FFT (Fast Fourier transform) conversion. This would be an example of HF (high-frequency), since the peak in the graph on the right is within the range of 0.075 and 0.15. It is not LF (low-frequency), so we don't have to talk about that.
Thank you all for your input and for the wholesomeness.
Have a fantastic night everyone!
A pleasure as usual~
a reply to: Sookiechacha
To note, good sirs and/or madams, this is not just a reply to you but to the thread itself, to close it. Thank you for your analysis!
BEHOLD! THE ABRIDGED ANSWER TO THE QUESTION STATED IN THE OP
Also, the topic is Psychophysiology

ANSWER: The figure on the left is essentially an uncompressed form of the figure on the right. The figure on the right is measured in Hertz (Hz) and is a potential indicator of emotional adjustment level, hence the FFT (Fast Fourier transform) conversion. This would be an example of HF (high-frequency), since the peak in the graph on the right is within the range of 0.075 and 0.15. It is not LF (low-frequency), so we don't have to talk about that.
Thank you all for your input and for the wholesomeness.
Have a fantastic night everyone!
A pleasure as usual~
edit on 17-3-2021 by rukia because: BRETHREN, I BRING TIDINGS OF PHYSIOLOGICAL PSYCHOLOGY A N S W E R S
I read the paper in your extra source link, but I didn't see anything about showing pictures, like in the question you are trying to answer. So that question in your opening post must relate to a different paper, post the link to that paper. I don't even see units on the RRI graph on the left, where the values go from approximately 600 to 800, that's 600 to 800 what, exactly? Milliseconds? If so, why doesn't it say so? The graph on the right appears to have units.
originally posted by: rukia
So this question was posed and I was curious as to the correct answer. There is no rush--I am merely curious and would especially like to understand the equations in the link provided if any of you would be so kind as to explain some basics to me :3
If anyone could provide me with the correct answer to the question in the first picture, I will give you one whole cookie
Extra source (incl. the equations)
a reply to: Arbitrageur
The extra source link does indeed have -nothing- to do with the academic article (other than sharing a variable). I just found it when I was refreshing myself on the jargon.
The extra source link does indeed have -nothing- to do with the academic article (other than sharing a variable). I just found it when I was refreshing myself on the jargon.
edit on 17-3-2021 by rukia because: (no reason given)
a reply to: Arbitrageur
I apologize--they are from the university library and I can't really share the whole thing with you. I gave you the abstract, pictures, the title, and the authors' names. That should be enough for you to find it
The thing both articles share in common is that they reference the same variable.
I apologize--they are from the university library and I can't really share the whole thing with you. I gave you the abstract, pictures, the title, and the authors' names. That should be enough for you to find it
The thing both articles share in common is that they reference the same variable.
edit on 17-3-2021 by rukia because: (no reason
given)
All I am saying is the answer to question 11 is correct. That's the end
I appreciate the assistance! In the end we solved the problem and it's all good mate
ごめんなさい
I appreciate the assistance! In the end we solved the problem and it's all good mate
ごめんなさい
edit on 17-3-2021 by rukia because: (no reason given)
originally posted by: rukia
a reply to: Xtrozero
a reply to: Sookiechacha
To note, good sirs and/or madams, this is not just a reply to you but to the thread itself, to close it. Thank you for your analysis!
BEHOLD! THE ABRIDGED ANSWER TO THE QUESTION STATED IN THE OP
Also, the topic is Psychophysiology
ANSWER: The figure on the left is essentially an uncompressed form of the figure on the right. The figure on the right is measured in Hertz (Hz) and is a potential indicator of emotional adjustment level, hence the FFT (Fast Fourier transform) conversion. This would be an example of HF (high-frequency), since the peak in the graph on the right is within the range of 0.075 and 0.15. It is not LF (low-frequency), so we don't have to talk about that.
Thank you all for your input and for the wholesomeness.
Have a fantastic night everyone!
A pleasure as usual~
You should have asked what he wanted to build.
originally posted by: Arbitrageur
I read the paper in your extra source link, but I didn't see anything about showing pictures, like in the question you are trying to answer. So that question in your opening post must relate to a different paper, post the link to that paper. I don't even see units on the RRI graph on the left, where the values go from approximately 600 to 800, that's 600 to 800 what, exactly? Milliseconds? If so, why doesn't it say so? The graph on the right appears to have units.
originally posted by: rukia
So this question was posed and I was curious as to the correct answer. There is no rush--I am merely curious and would especially like to understand the equations in the link provided if any of you would be so kind as to explain some basics to me :3
If anyone could provide me with the correct answer to the question in the first picture, I will give you one whole cookie
Extra source (incl. the equations)
Now you are at the crux of the issue....relativity.....ask what the intended use is before you connect the dots....there are multiple tactical applications for this data.
edit on 18-3-2021 by one4all because: (no reason given)
new topics
-
Boy Scouts to be renamed next year
Other Current Events: 1 hours ago -
Pfizer agrees to settle over 10,000 Zantac lawsuits after cancer causing substance found in drug
Medical Issues & Conspiracies: 1 hours ago -
Judas Iscariot Slips The Hangman's Noose
Political Issues: 5 hours ago -
Murder Suicide Investigation Still Active 4 months later?
Other Current Events: 5 hours ago -
A Shout-out To truthseeker45 Hoot Hoot
General Chit Chat: 7 hours ago -
Ooooh...it worked!!
Members: 9 hours ago
top topics
-
Court of Appeals Agrees to Hear Trump Appeal to Flush Fani Willis
US Political Madness: 15 hours ago, 15 flags -
Ooooh...it worked!!
Members: 9 hours ago, 15 flags -
President Bidens Health is Declining Faster 5.8.2024 - He Should Stay Home.
2024 Elections: 14 hours ago, 9 flags -
New House GOP Bill To Send Pro Hamas College Law Breakers to Gaza for 6 Months
Social Issues and Civil Unrest: 12 hours ago, 9 flags -
Judas Iscariot Slips The Hangman's Noose
Political Issues: 5 hours ago, 8 flags -
A Shout-out To truthseeker45 Hoot Hoot
General Chit Chat: 7 hours ago, 4 flags -
Murder Suicide Investigation Still Active 4 months later?
Other Current Events: 5 hours ago, 2 flags -
Pentagon UFO Hunter Reveals What He Knows About Aliens: Nothing
Aliens and UFOs: 13 hours ago, 2 flags -
Pfizer agrees to settle over 10,000 Zantac lawsuits after cancer causing substance found in drug
Medical Issues & Conspiracies: 1 hours ago, 2 flags -
Boy Scouts to be renamed next year
Other Current Events: 1 hours ago, 1 flags
active topics
-
Judas Iscariot Slips The Hangman's Noose
Political Issues • 19 • : charlest2 -
Russia Ukraine Update Thread - part 3
World War Three • 5765 • : F2d5thCavv2 -
The Vaccine Injured
Medical Issues & Conspiracies • 30 • : PrivateAngel -
Ooooh...it worked!!
Members • 10 • : angelchemuel -
Don’t Obstruct the Leftist Implosion
US Political Madness • 32 • : Terpene -
New whistleblower Jason Sands speaks on Twitter Spaces last night.
Aliens and UFOs • 125 • : baablacksheep1 -
New House GOP Bill To Send Pro Hamas College Law Breakers to Gaza for 6 Months
Social Issues and Civil Unrest • 83 • : Asher47 -
A Note Found On A Windshield in Italy.
General Conspiracies • 83 • : AdultMaleHumanUK -
Boy Scouts to be renamed next year
Other Current Events • 1 • : FlyersFan -
The More things Change The More They stay the Same
Above Politics • 5 • : Hemanth
