It looks like you're using an Ad Blocker.
Please white-list or disable AboveTopSecret.com in your ad-blocking tool.
Thank you.
Some features of ATS will be disabled while you continue to use an ad-blocker.

Quake Watch 2015
page: 41share:
M4.8 - 183km W of Port Hardy, CanadaTime
2015-07-30 00:31:06 (UTC)
Nearby Cities
183km (114mi) W of Port Hardy, Canada
346km (215mi) WNW of Campbell River, Canada
373km (232mi) WNW of Courtenay, Canada
399km (248mi) WNW of Powell River, Canada
539km (335mi) WNW of Victoria, Canada
earthquake.usgs.gov...
2015-07-30 00:31:06 (UTC)
Nearby Cities
183km (114mi) W of Port Hardy, Canada
346km (215mi) WNW of Campbell River, Canada
373km (232mi) WNW of Courtenay, Canada
399km (248mi) WNW of Powell River, Canada
539km (335mi) WNW of Victoria, Canada
earthquake.usgs.gov...
a reply to: muzzy
Home now and looking on Google Earth, the quake is about 245km SE of the most southerly part of the main Barrier Reef, at the base of the Continental Shelf.
Not sure what that quake is about, the Australian Plate subduction zone is 1565km NE at the New Hebrides Trench off New Caledonia, so not a thrust quake.
USGS strikes again! Probably not their fault but one of the networks is coming in as 'ismbkansas' which is obviously cojones but is zapping the
downloads for USGS in QVSData.
Download and run this fix which is for both Standard and Pro versions. When it opens you will be required to find the database. If using standard it should be in QVS Standard and if Pro it should be in QVS Pro. You will find later these go and only one QVSData Logs folder will be present regardless of version. In case of problems PM or email me.
Download the database fix (ZIP)
a reply to: PuterMan
Actually it was ismpkansas. This is a new network code and is correct. The reply I got from USGS is telling
Note the words INDUCED SEISMICITY in other words they are checking fracking quakes. Since these will presumable all be prefixed 'is' as in 'ismpkansas' it should be possible to extract just IS quakes. I will make sure the program can do that.
Actually it was ismpkansas. This is a new network code and is correct. The reply I got from USGS is telling
This is a longer catalog code than the usual two character codes, and is one of the first of several new near-realtime catalogs we are adding to our systems. These are contributions from the USGS Induced Seismicity Project.
Note the words INDUCED SEISMICITY in other words they are checking fracking quakes. Since these will presumable all be prefixed 'is' as in 'ismpkansas' it should be possible to extract just IS quakes. I will make sure the program can do that.
Hello! I was wondering if anyone with some skills could comment on the large number of quakes near Puerto Rico?
I am surprised there hasn't been a discussion on it.
Thank you in advance
I am surprised there hasn't been a discussion on it.
Thank you in advance
a reply to: ujustneverknow
Indeed.
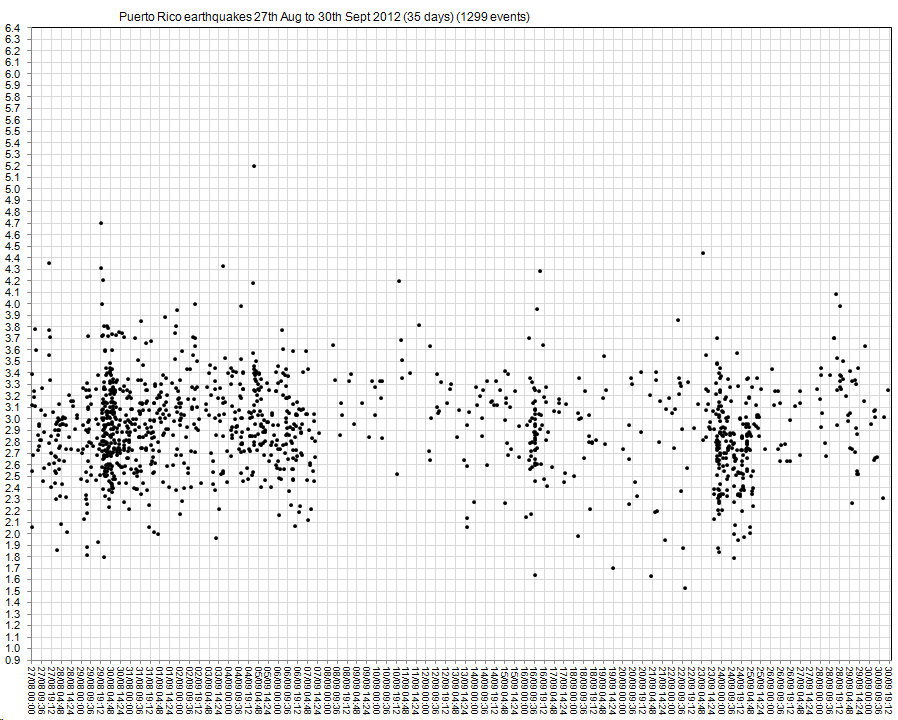
You can see the recent upsurge on this 4.5 year time versus magnitude graph created with data from the Puerto Rican Seismic Network
rightclickviewimage for full size
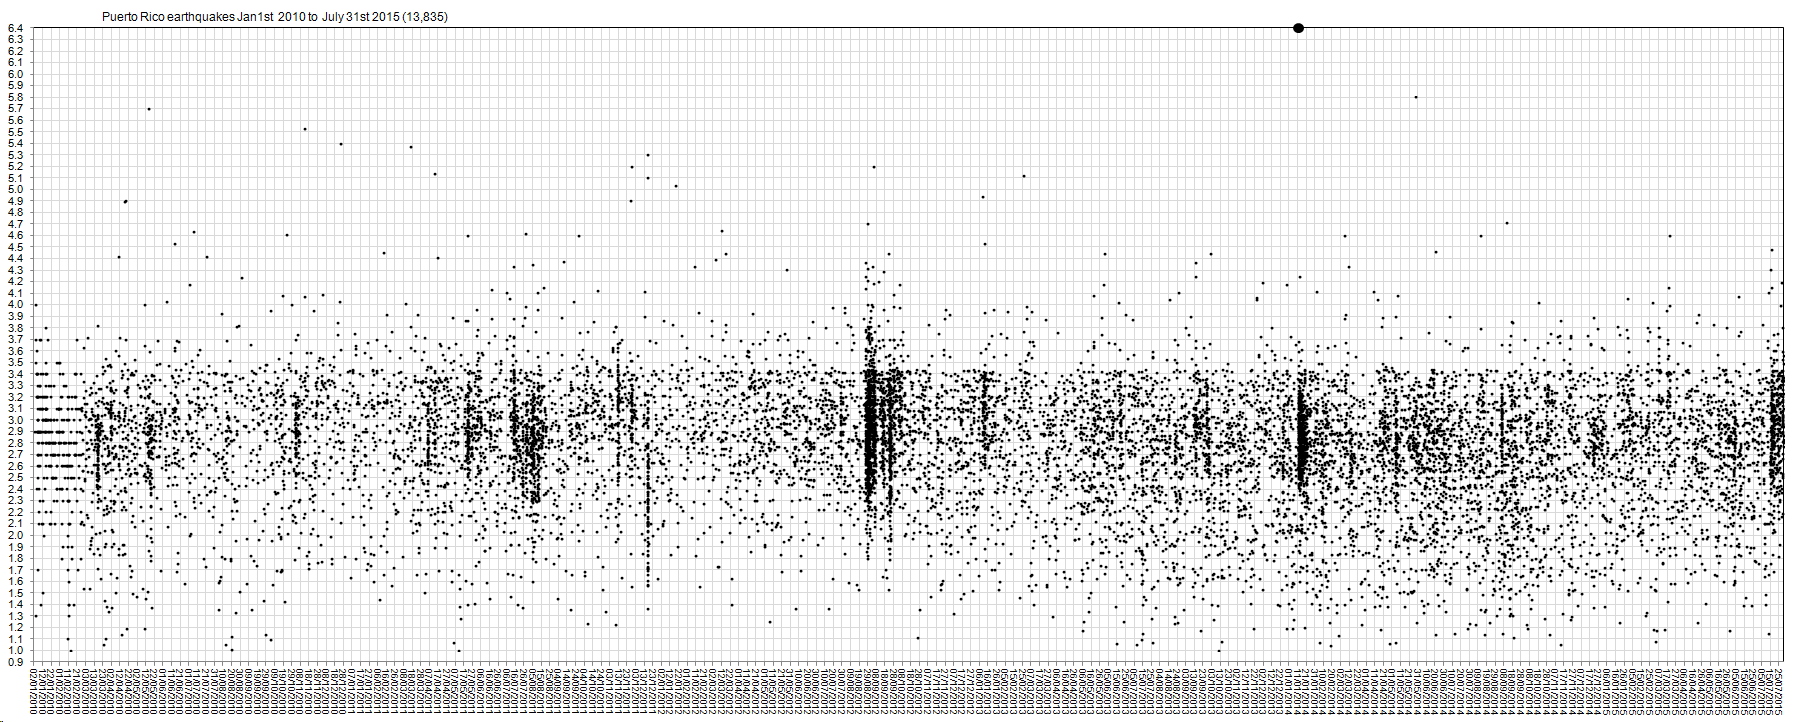
They started using 2 decimal places on 26/02/2010, that's why the first part of the graph looks different.
Nothing as intense as this since the Jan 2014 M6.4 and aftershocks.
That Aug-Sep-Oct 2012 Swarm was a doozy. I remember it was quite the topic on QW2012. M5.2 was the biggest in that, on 05/09/2012.
I'll break those thicker bunches down a bit.
Indeed.
You can see the recent upsurge on this 4.5 year time versus magnitude graph created with data from the Puerto Rican Seismic Network
rightclickviewimage for full size
They started using 2 decimal places on 26/02/2010, that's why the first part of the graph looks different.
Nothing as intense as this since the Jan 2014 M6.4 and aftershocks.
That Aug-Sep-Oct 2012 Swarm was a doozy. I remember it was quite the topic on QW2012. M5.2 was the biggest in that, on 05/09/2012.
I'll break those thicker bunches down a bit.
a reply to: ujustneverknow
No problem
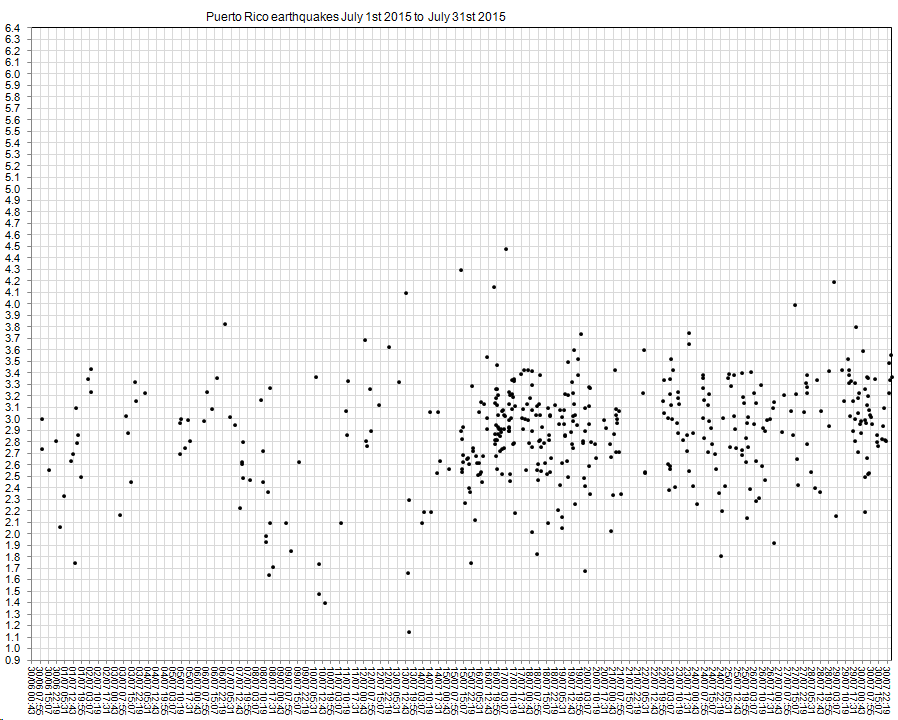
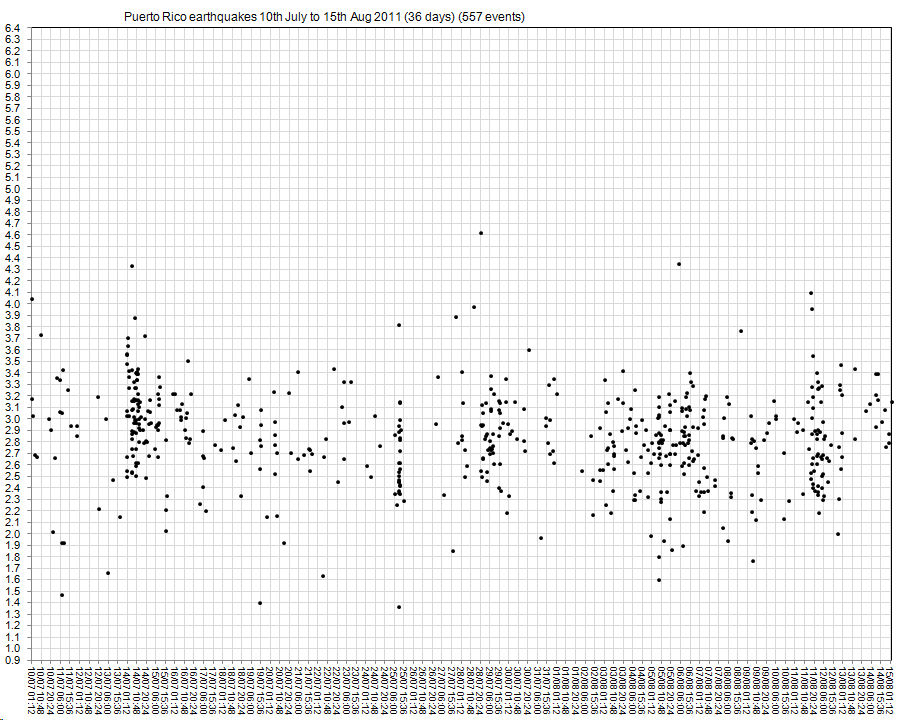
Looks like it started on the 15th July
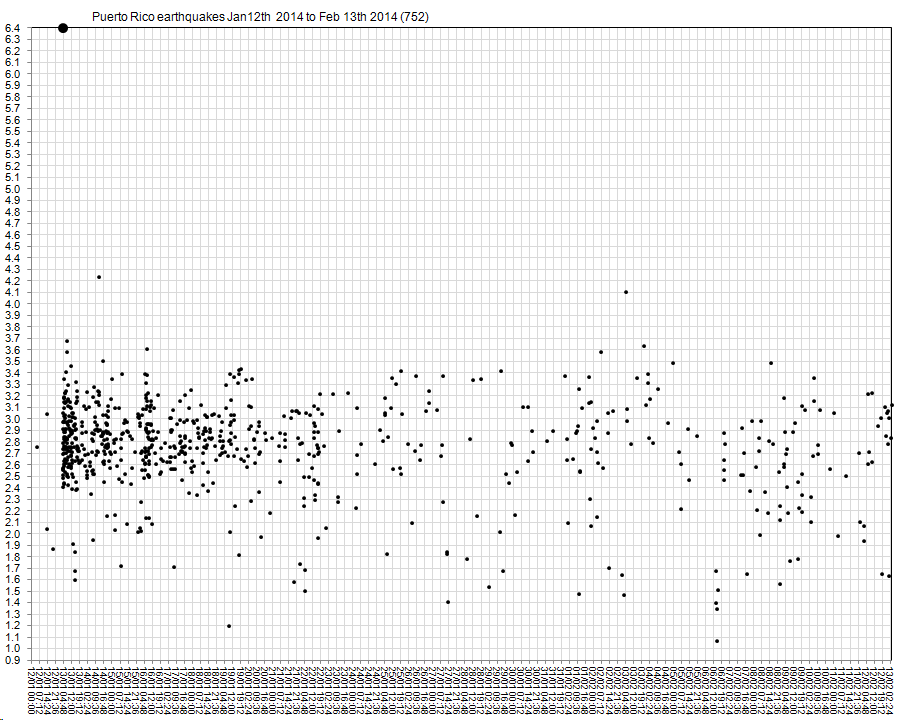
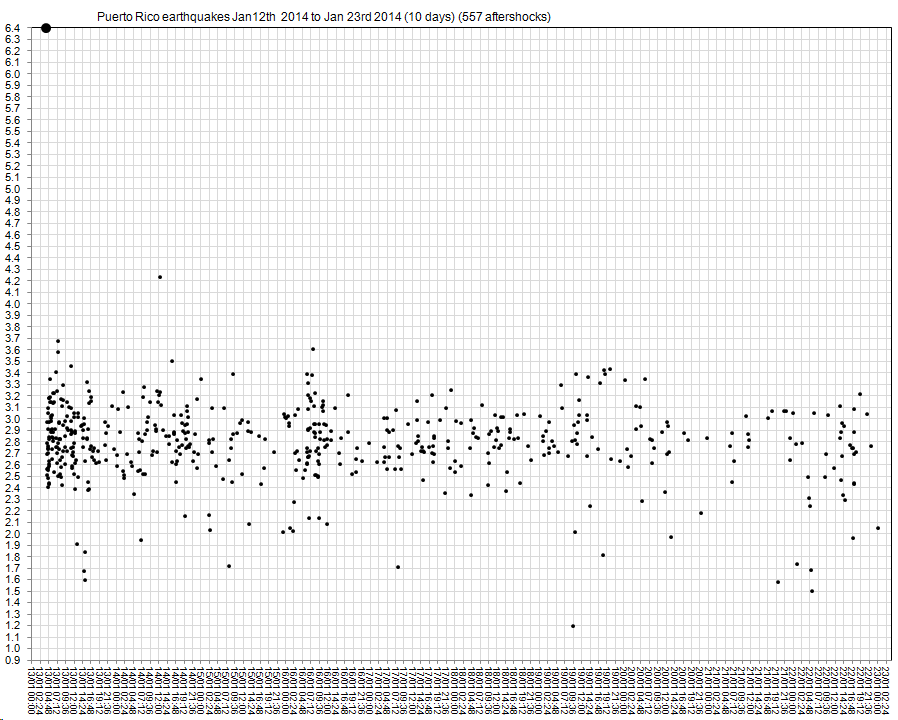
Here is the 13th Jan 2014 +30 days M6.4 graph, it returned to normal pretty quickly, within 10 days.
and the Aug-Sept 2012 Swarm
and the July-Aug 2011 Swarm
rightclickviewimage for all the full size graphs.
there are lots of series in that original graph/post
No problem
Looks like it started on the 15th July
Here is the 13th Jan 2014 +30 days M6.4 graph, it returned to normal pretty quickly, within 10 days.
and the Aug-Sept 2012 Swarm
and the July-Aug 2011 Swarm
rightclickviewimage for all the full size graphs.
there are lots of series in that original graph/post
edit on 0700000021121115 by muzzy because: probably could have made the graphs a bit squatter to make them fit in the screen without having to
scroll.
edit on 0700000021121115 by muzzy because: 31th replaced with 13th LOL
I covered Puerto Rico as part of the ANSS USA page for 3 years, but when Google dumped the Classic Maps, the maps all went blank.
maybe I could replace them with graphs instead?
Meantime, during the 2 rainy days earlier in the week I set up the EMSC Tables on another defunct Blog, Global Siesmic Archives
renamed it Global Earthquake Survey Tables and IRIS Webicorders
Puterman did a ton of work on those webicorder graphs, too much to lose.
I've set up a couple of pages off the menu dropdown, Energy, and Counts, so you can compare year to year.
Will do some more when I get time.
a reply to: muzzy
I really should find time to update it all. I still have, and collect daily, all the IRIS seismograms in those pages. Maybe when I get this new release of QVSData out I will find the time. Being retired is just so busy! Life was easier at work.
I really should find time to update it all. I still have, and collect daily, all the IRIS seismograms in those pages. Maybe when I get this new release of QVSData out I will find the time. Being retired is just so busy! Life was easier at work.
Had a crack at converting one of the posts on Earthquake Archives to Bing Maps.
I picked the last entry I posted before Google went into the abyss of uselessness.
Samothraki, Aegean Sea 6.8Mw, 24/05/2014 and aftershocks
Using the existing KMZ files I have stored on Dropbox, with some adjustments (removed the Plate Boundries, as Bing puts them first, and then there is no room for the earthquakes).
Ticking along nicely with the new format, then before I even got to the 24 hour mark I reached the limit of icons for Bing - 200, at the 16:21hr mark.
There were 749 aftershocks in the first 139 hours (5.79 days), but I can't map them,
unless I redo the KMZ files from 16:21hrs on and break them down into;
next 200, next 200 etc
I could also break the hours down to 4 hour maps, as before on Google Classic, but that would mean I would have to rewrite the KMZ files from scratch off the data, as I originally used the "illusion" icon for all the previous quakes to show the pattern developing. This is the whole point of it, to see the Fault. Unfortunately Bing shows the illusion icon as a number, so I had to re title each map 0-1, 0-4, 0-8, 0-12 etc instead of the original 1-1, 1-4, 4-8, 8-12 tec.
Messy.
I have left the rest of the blank Google Maps there for now until I decide how to deal with this.
edit on 0700000021121115 by muzzy because: (no reason given)
a reply to: muzzy
I have decided to keep those I did this morning (cumulative up to 200 events) but also redo the 4 hourly ones up to 139 hours. The Bing tags were a bit messy as they don't accept html code, so its just a continuous line of text, the Lat/Long numbers were mixing with the elapsed time on the popup tags, so I will redo them all to fix that. Have redone the first one, 0-1hr.
Project for the day.
Cold and Showers here.
M5.6 - 133km ENE of Rainbow Beach, Australia
25.368°S 154.282°E depth=10.0 km (6.2 mi)
Time
2015-08-01 03:38:44 (UTC)
2015-07-31 22:38:44 (UTC-05:00) in your timezone
Times in other timezones
Nearby Cities
133km (83mi) ENE of Rainbow Beach, Australia
142km (88mi) E of Torquay, Australia
159km (99mi) NE of Noosa Heads, Australia
160km (99mi) E of Maryborough, Australia
264km (164mi) NNE of Brisbane, Australia
USGS
a reply to: lurksoften
Yeah - just got a message from friend who felt the 5.6 at Gold Coast.
Some weird activity on East Coast of Australia... couple days back a 5.7, this morning a 2.8, and just couple hours ago another 5.6 - what gives??
Yeah - just got a message from friend who felt the 5.6 at Gold Coast.
Some weird activity on East Coast of Australia... couple days back a 5.7, this morning a 2.8, and just couple hours ago another 5.6 - what gives??
edit on 31/7/15 by Navieko because: (no reason given)
And followed by a 5.2 an hour later!
Type: EarthQuake
65 minutes ago
Magnitude: 5.2
DateTime: 2015-07-31 23:46:23
Region: Offshore E of Fraser Island, QLD.
Depth: 0
Source: GeoScience Australia
Unusual activity?
Type: EarthQuake
65 minutes ago
Magnitude: 5.2
DateTime: 2015-07-31 23:46:23
Region: Offshore E of Fraser Island, QLD.
Depth: 0
Source: GeoScience Australia
Unusual activity?
Again, I didn't feel!
You guys should have seen the news reports here thursday night after the first one, "It could mean, we are in store for a much bigger quake" It was fear mongering at its finest. Another local "Storm chasing" network took it upon themselves to send out a tsunami warning via their app to 400 THOUSAND people, with no knowledge on the hows and whys tsunamis happen. I think they should face some sort of penalty due to the sheer panic something like that could cause. They copped a lot of flack on Facebook and have since deleted their posts about how it is up to them to warn the people, because apparently BOM or PTWC don't know how to do their jobs. (being that we live surrounded by PNG, Torres Strait, Samoa, Tonga, NZ I think maybe, just maybe the PTWC might know what they're doing, but hey)
Obviously, it is unusual for us, exciting, being that this one today is the biggest one since 1918 I've just read at www.news.com.au... but the rate at which people are losing their minds over it is scary. I do wonder what's the go though, as like you said Muzzy, we don't have much going on around here (that we know of I guess the same could have be said before Japan surprised them all)
edit on 1/8/2015 by bkaust because:
(no reason given)
edit on 1/8/2015 by bkaust because: Link wasn't working
a reply to: bkaust
From your article...
I hope you all are safe there and that these unusual quakes are finished. Any thoughts Muzzy?
From your article...
Generally we see the magnitude of earthquakes going down but it appears Thursday was a foreshock to today,’’ she said.
“We can definitely expect to feel more tremors and it is possible we could still be in for something bigger still.’’
She warned coast residents should be vigilant because “these events can cause tsunami’’.
I hope you all are safe there and that these unusual quakes are finished. Any thoughts Muzzy?
a reply to: whatnext21
The Tasman Sea is a spreading seafloor, NZ and Australia are spreading apart.
The Eastern Australian Continental slope is quite steep (4-5 degrees) and where the Tasman Abyssal Plain butts into it is the deepest part (of the Plain).
Although the Tasman Plain looks flat, there is 60 million years of sediment overlaying the rocky floor there.
During the period 2.6 million to 11,700 years ago (Pleistocene period) there is evidence of warping of the Continental Shelf (Phipps 1967), it appears the continental margin is probably still sinking at a very slow rate.(ref: Intraplate Volcanism: In Eastern Australia and New Zealand By R. Wally Johnson)
The latest quake, a 3.1 at -25.635, 153.979 is located under the Continental Shelf, closer to the current coastline, 20 or so km SW of the other quakes (and 10km deep versus 30km for the others), this may indicate a case of subsidence along the self. There is also a fold (trough) running from Recorder Guyot SW towards Rainbow Beach, where it cuts into the Continental Slope it is 100m deep below the surrounding sea floor, this may indicate an ancient fault, these latest earthquakes are parallel to this fold.
rightclickviewimage for full size
A Guyot is a flat topped ex-volcano, Recorder is pretty high, just under 4km from the seabed, thats huge. If you look on Google Earth or Satelitte Map you can see a trail of seamounts running parallel with the current Australian coast, these are called the Tasmantid Guyots, estimated age is 65-2 million years ago (Tertiary period). The oldest guyot's are at the north, the current volcanic hotspot is estimated to now be SW of Tasmania.
GeoAu earthquake Search results
Something isn't right, NZ has been really quiet the last month, some of the lowest daily energy releases for years, now this.
Hey the Aussies are always stealing our stuff, Russell Crowe, Pavlova, Phar Lap (a race horse), Split Enz, to name a few, claiming them as Australian when they were actually from NZ, now they are stealing our earthquakes! LOL
They can have them as far as I'm concerned.
Mines closing down, Ranches being sold off to the Chinese, Floods, Fires, Refugees, Unemployment on the rise, losing two Test series of Cricket to the English ........
Maybe the "Lucky Country"s luck has just about run out.
Worse case scenerio is part of the Continental Shelf collapses, causing a massive Tsunami which heads east towards me.
What we need is a big picture.
Earthquake History 1910-present Queensland Coast, from GeoAu.
That Red one was a M6.0, off the Barrier Reef (thats why I mentioned this location when the first 5.7 came up)
The set in the glass disk is the present performance.
The Tasman Sea is a spreading seafloor, NZ and Australia are spreading apart.
The Eastern Australian Continental slope is quite steep (4-5 degrees) and where the Tasman Abyssal Plain butts into it is the deepest part (of the Plain).
Although the Tasman Plain looks flat, there is 60 million years of sediment overlaying the rocky floor there.
During the period 2.6 million to 11,700 years ago (Pleistocene period) there is evidence of warping of the Continental Shelf (Phipps 1967), it appears the continental margin is probably still sinking at a very slow rate.(ref: Intraplate Volcanism: In Eastern Australia and New Zealand By R. Wally Johnson)
The latest quake, a 3.1 at -25.635, 153.979 is located under the Continental Shelf, closer to the current coastline, 20 or so km SW of the other quakes (and 10km deep versus 30km for the others), this may indicate a case of subsidence along the self. There is also a fold (trough) running from Recorder Guyot SW towards Rainbow Beach, where it cuts into the Continental Slope it is 100m deep below the surrounding sea floor, this may indicate an ancient fault, these latest earthquakes are parallel to this fold.
rightclickviewimage for full size
A Guyot is a flat topped ex-volcano, Recorder is pretty high, just under 4km from the seabed, thats huge. If you look on Google Earth or Satelitte Map you can see a trail of seamounts running parallel with the current Australian coast, these are called the Tasmantid Guyots, estimated age is 65-2 million years ago (Tertiary period). The oldest guyot's are at the north, the current volcanic hotspot is estimated to now be SW of Tasmania.
GeoAu earthquake Search results
Something isn't right, NZ has been really quiet the last month, some of the lowest daily energy releases for years, now this.
Hey the Aussies are always stealing our stuff, Russell Crowe, Pavlova, Phar Lap (a race horse), Split Enz, to name a few, claiming them as Australian when they were actually from NZ, now they are stealing our earthquakes! LOL
They can have them as far as I'm concerned.
Mines closing down, Ranches being sold off to the Chinese, Floods, Fires, Refugees, Unemployment on the rise, losing two Test series of Cricket to the English ........
Maybe the "Lucky Country"s luck has just about run out.
edit on 0800000021221215 by muzzy because: (no reason given)
edit on
0800000021221215 by muzzy because: (no reason given)
Worse case scenerio is part of the Continental Shelf collapses, causing a massive Tsunami which heads east towards me.
What we need is a big picture.
Earthquake History 1910-present Queensland Coast, from GeoAu.
That Red one was a M6.0, off the Barrier Reef (thats why I mentioned this location when the first 5.7 came up)
The set in the glass disk is the present performance.
edit on 0800000021221215 by muzzy because: I see from doing this map, that USGS are using National Geographic Maps
for their Summary location maps.
Maybe the media should consult the Aborigine Elders, they would probably have a perfectly sound explanation for these geological visitations.
edit on 0800000021221215 by muzzy because: added another map, showing the fold(fault?)
Maybe the media should consult the Aborigine Elders, they would probably have a perfectly sound explanation for these geological visitations.
edit on 0800000021221215 by muzzy because: added another thought
extra DIV new topics
-
Harris economic plans all seem to involve giving money away
US Political Madness: 13 minutes ago -
Israel Defense Forces Shoot American Woman in the Head in Occupied West Bank
Middle East Issues: 1 hours ago -
Flashback to Kamala Chameleon Calling for Paper Ballots as a Senator
US Political Madness: 4 hours ago -
Secrets of the Name of God & His Epithets (Titles) in the Holy Bible. Life Changing Stuff...
Conspiracies in Religions: 5 hours ago -
Father of teen suspect in Georgia school shooting charged with 2nd-degree murder
Mainstream News: 11 hours ago
top topics
-
This is why they tried to kill DJTrump.
Politicians & People: 17 hours ago, 15 flags -
Democrat VP Candidate Tim Walz Issued Subpoena For $250M COVID-19 Nonprofit ‘Fraud Scheme’
2024 Elections: 16 hours ago, 15 flags -
Father of teen suspect in Georgia school shooting charged with 2nd-degree murder
Mainstream News: 11 hours ago, 14 flags -
Due to Trump Leading the Race for President - NY Judge Merchan Will Sentence Him to Prison 9.18.2024
US Political Madness: 12 hours ago, 13 flags -
What is going on with Adams?
Regional Politics: 16 hours ago, 10 flags -
Flashback to Kamala Chameleon Calling for Paper Ballots as a Senator
US Political Madness: 4 hours ago, 10 flags -
This is an anti-free speech right/Nazi/Right Conservatives, a Pro-LGBT community that supports BLM
Rant: 16 hours ago, 4 flags -
Israel Defense Forces Shoot American Woman in the Head in Occupied West Bank
Middle East Issues: 1 hours ago, 3 flags -
Secrets of the Name of God & His Epithets (Titles) in the Holy Bible. Life Changing Stuff...
Conspiracies in Religions: 5 hours ago, 2 flags -
Harris economic plans all seem to involve giving money away
US Political Madness: 13 minutes ago, 2 flags
active topics
-
This is an anti-free speech right/Nazi/Right Conservatives, a Pro-LGBT community that supports BLM
Rant • 31 • : BasicResearchMethods -
Casualties reported after school shooting at Apalachee High School
Other Current Events • 299 • : MrGashler -
Israel Defense Forces Shoot American Woman in the Head in Occupied West Bank
Middle East Issues • 18 • : xuenchen -
KAMALA HARRIS is Having a Hard Time Readying for the 9-10-2024 Debate with Donald Trump.
2024 Elections • 66 • : Oldcarpy2 -
US Army Rebukes Trump Campaign
US Political Madness • 376 • : matafuchs -
A Step Too Far
World War Three • 117 • : Oldcarpy2 -
Harris economic plans all seem to involve giving money away
US Political Madness • 0 • : network dude -
The Gorgeous new Aston Martin Vanquish 2025 .
Automotive Discussion • 20 • : BedevereTheWise -
Due to Trump Leading the Race for President - NY Judge Merchan Will Sentence Him to Prison 9.18.2024
US Political Madness • 35 • : xuenchen -
-@TH3WH17ERABB17- -Q- ---TIME TO SHOW THE WORLD--- -Part- --44--
Dissecting Disinformation • 2510 • : Thoughtful3