It looks like you're using an Ad Blocker.
Please white-list or disable AboveTopSecret.com in your ad-blocking tool.
Thank you.
Some features of ATS will be disabled while you continue to use an ad-blocker.
share:
In honour of our Sun and the ever approaching solar maximum which we are to expect later this year, I wanted to share some amazing pictures captured
of our parent star.
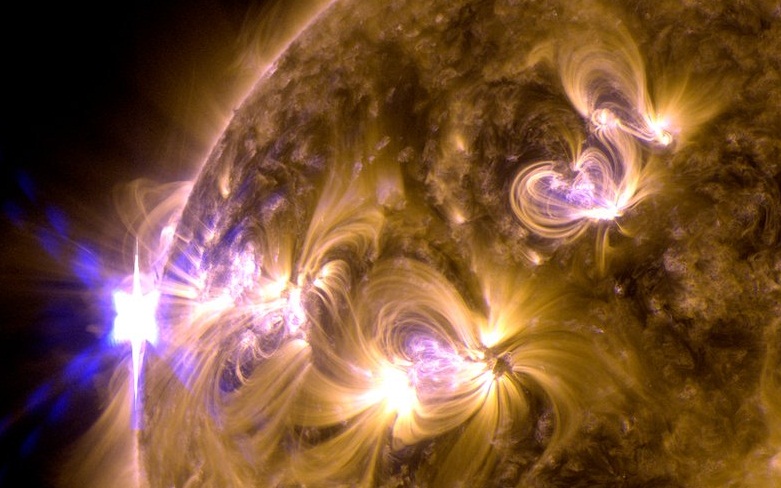
Between 12 and 14 May, the Sun unleashed four intense bursts of radiation, or flares. These X-class flares - the most intense type - represent the strongest activity on the Sun so far in 2013. This picture from Nasa's Solar Dynamics Observatory (SDO) shows the first of these on 12 May.
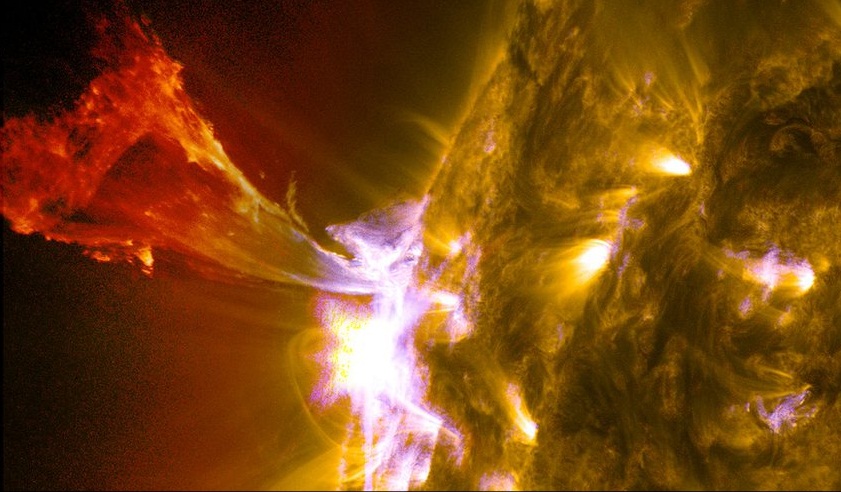
This picture from SDO shows a flare subsiding as a burst of material leaps out from the same region into space on 3 May 2013.
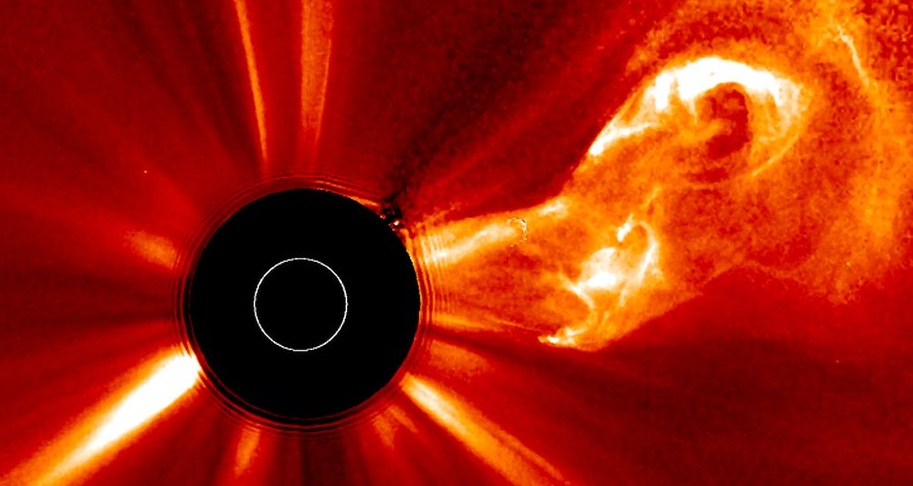
This picture from the Stereo spacecraft shows a CME earlier this year. The black disc blocks out the Sun so that fainter features can be seen.
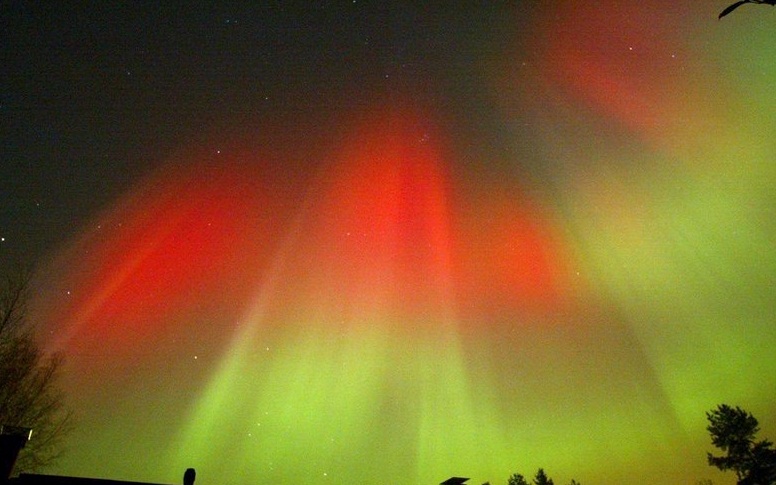
When the particles from a CME reach the atmosphere, they can cause bright aurorae (Northern and Southern lights). Strong CMEs can also disrupt technology, potentially tripping electronics in satellites and blowing out transformers in power grids.
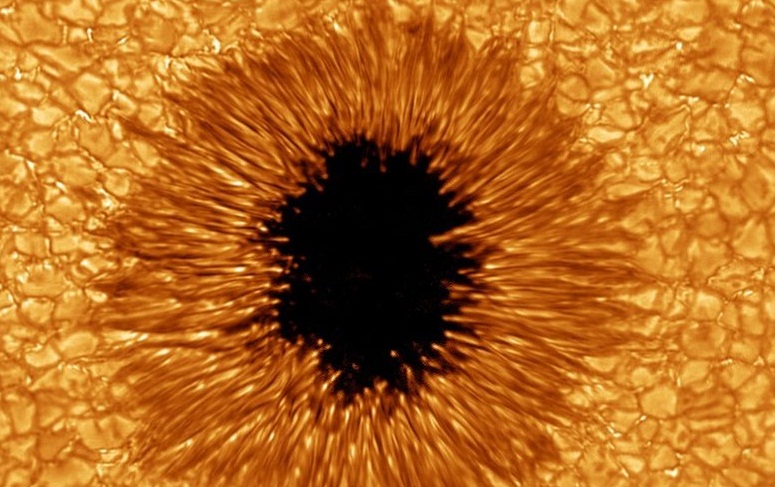
Flares and CMEs originate around active regions known as sunspots. These are temporary dark patches on the Sun caused by magnetic activity. The recent flares were released from a sunspot called AR1748; this picture, taken in 2010 by the New Solar Telescope in New Jersey shows a different feature.
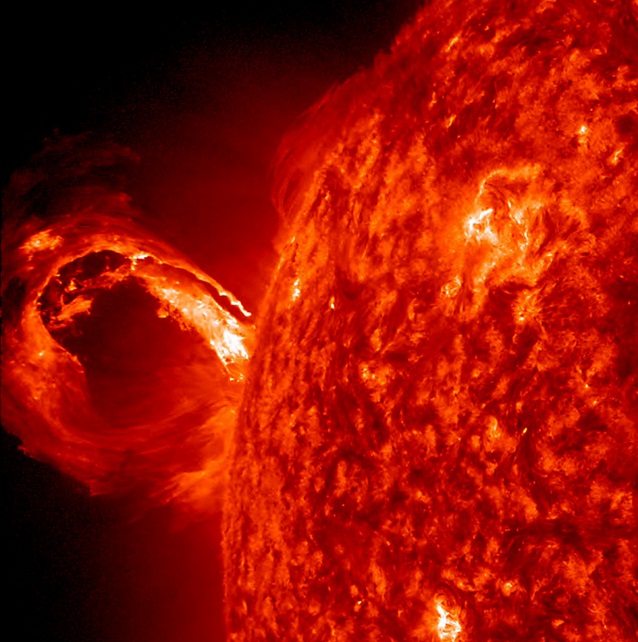
Nasa's SDO spacecraft carries high performance cameras that can produce movies with a similar resolution to High-Definition video. This picture shows a bright gaseous prominence erupting from the Sun on 31 August 2012.
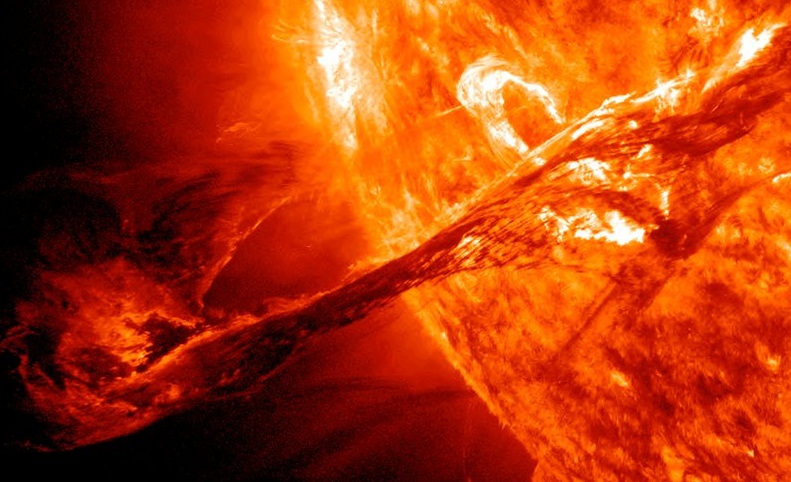
A corona mass ejection (CME), associated with a solar flare, blew out from just around the edge of the Sun in a glorious roiling wave (May 1, 2013).
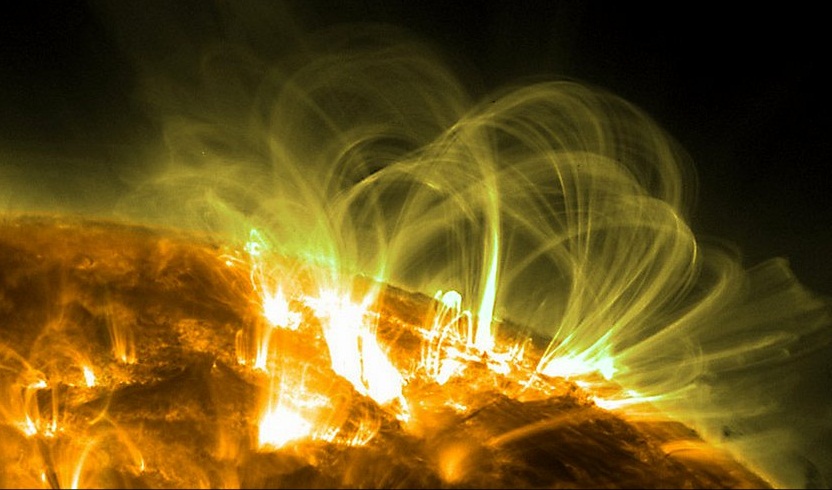
Magnetic loops can also put on a dazzling display for watching spacecraft. They are formed by charged particles spinning along magnetic field lines that emanate from active regions such as sunspots.
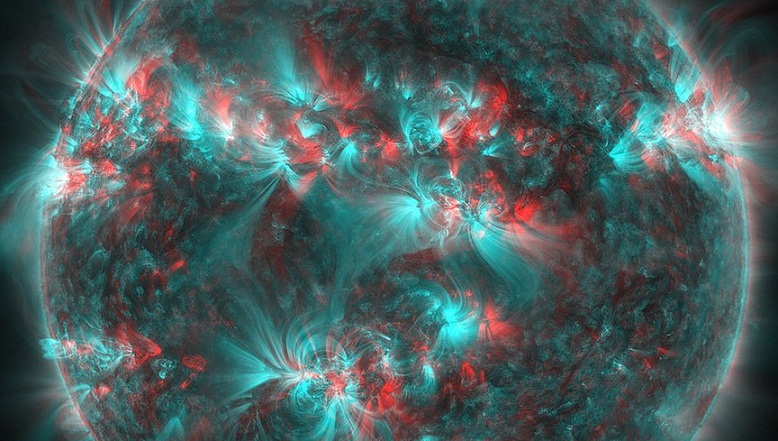
To create this colourful image, SDO took pairs of high-resolution pictures from 4 December 2011 about eight hours apart. They were then transformed into a 3-D picture using image software.
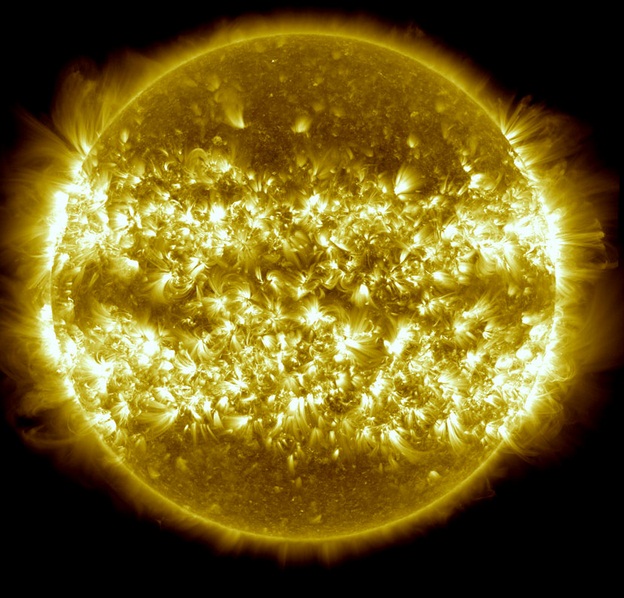
This image is a composite of 25 separate images spanning the period of April 16, 2012 to April 15, 2013. It uses the SDO AIA wavelength of 171 Angstroms and reveals the zones on the sun where active regions are most common during this part of the solar cycle.
I hope we get to capture yet more beautiful images as the solar maximum reaches its peak .
Nasa Solar Dynamics Observatory
Link 2
Between 12 and 14 May, the Sun unleashed four intense bursts of radiation, or flares. These X-class flares - the most intense type - represent the strongest activity on the Sun so far in 2013. This picture from Nasa's Solar Dynamics Observatory (SDO) shows the first of these on 12 May.

This picture from SDO shows a flare subsiding as a burst of material leaps out from the same region into space on 3 May 2013.

This picture from the Stereo spacecraft shows a CME earlier this year. The black disc blocks out the Sun so that fainter features can be seen.

When the particles from a CME reach the atmosphere, they can cause bright aurorae (Northern and Southern lights). Strong CMEs can also disrupt technology, potentially tripping electronics in satellites and blowing out transformers in power grids.

Flares and CMEs originate around active regions known as sunspots. These are temporary dark patches on the Sun caused by magnetic activity. The recent flares were released from a sunspot called AR1748; this picture, taken in 2010 by the New Solar Telescope in New Jersey shows a different feature.

Nasa's SDO spacecraft carries high performance cameras that can produce movies with a similar resolution to High-Definition video. This picture shows a bright gaseous prominence erupting from the Sun on 31 August 2012.

A corona mass ejection (CME), associated with a solar flare, blew out from just around the edge of the Sun in a glorious roiling wave (May 1, 2013).

Magnetic loops can also put on a dazzling display for watching spacecraft. They are formed by charged particles spinning along magnetic field lines that emanate from active regions such as sunspots.

To create this colourful image, SDO took pairs of high-resolution pictures from 4 December 2011 about eight hours apart. They were then transformed into a 3-D picture using image software.

This image is a composite of 25 separate images spanning the period of April 16, 2012 to April 15, 2013. It uses the SDO AIA wavelength of 171 Angstroms and reveals the zones on the sun where active regions are most common during this part of the solar cycle.

I hope we get to capture yet more beautiful images as the solar maximum reaches its peak .
Nasa Solar Dynamics Observatory
Link 2
edit on 19-5-2013 by Lady_Tuatha because: typo
So beautiful. Truly spectacular.
Thank you for this awe inspiring post!
Thank you for this awe inspiring post!
Brilliant.
My only problem now, is choosing what one I want as my wallpaper.
Thank you for sharing.
My only problem now, is choosing what one I want as my wallpaper.
Thank you for sharing.
Originally posted by Lady_Tuatha
Flares and CMEs originate around active regions known as sunspots. These are temporary dark patches on the Sun caused by magnetic activity. The recent flares were released from a sunspot called AR1748; this picture, taken in 2010 by the New Solar Telescope in New Jersey shows a different feature.
Sauroman. 'Nuff said.
When you tie it together as you did, it is almost like artwork.
Totally amazing pictures. The sun is one incredible mass of energy. And so beautiful with it, Thanks for sharing these
The fifth picture reminds me of the scientist (can't remember his name for the life of me) who says that the Sun is actually a hollow generator that
pulls power from another dimension (he says that's why beyond the fire, it's just blackness).
reply to post by this_is_who_we_are
sauron mate, the eye of sauron
but in reality it looks like a butt hole.
sauron mate, the eye of sauron
but in reality it looks like a butt hole.
Anyone remember this awesome pic:

It was from this thread made over a year ago. Apparently something impacted the sun and caused a massive flare, although I can't remember if that was the official conclusion on the matter. I just remember it because I'd never seen anything like it before.

It was from this thread made over a year ago. Apparently something impacted the sun and caused a massive flare, although I can't remember if that was the official conclusion on the matter. I just remember it because I'd never seen anything like it before.
edit on 20/5/2013 by ChaoticOrder because: (no reason given)
Originally posted by FollowTheWhiteRabbit
The fifth picture reminds me of the scientist (can't remember his name for the life of me) who says that the Sun is actually a hollow generator that pulls power from another dimension (he says that's why beyond the fire, it's just blackness).
This is a common misconception. Sunspots aren't black, they're just a lot darker than the surrounding sun. Cameras can't capture this entire range of brightness at once, they have limited dynamic range.
As a result, in order to show details in the bright areas of the sun, the dark areas must appear black.
Thing that just blew my mind is the realization that the Universe is only made up of these things and whatever circles them.
Just a trillion stars swirling about endlessly...
Just a trillion stars swirling about endlessly...
This fits in well with this thread I would think. Two square meters of focused sunlight can melt steel or even rocks. Over 3000°
Focused sunlight!
Focused sunlight!
Sorry double post not sure why .
edit on 20-5-2013 by JimboSliceLV because: Double posted
Originally posted by this_is_who_we_are
Originally posted by Lady_Tuatha
Sauroman. 'Nuff said.
No, Eye of Sauron....and that's enough said hahah
edit on 20-5-2013 by Skywatcher2011 because: (no reason given)
reply to post by Skywatcher2011
reply to post by FraternitasSaturni
One... little... mistake...
reply to post by FraternitasSaturni
One... little... mistake...
edit on 5/20/2013 by this_is_who_we_are because: second reply line
new topics
-
Results of the use of the Oreshnik missile system in Dnepropetrovsk
World War Three: 14 minutes ago -
Nigel Farage now the Most Favoured UK Politician
Regional Politics: 1 hours ago -
Little Johnny and Larry should team up
General Chit Chat: 8 hours ago -
Will Us use alien technology to fight in ww3?
World War Three: 8 hours ago
top topics
-
Elon Says It’s ‘Likely’ He Buys Tanking MSNBC
Political Ideology: 17 hours ago, 16 flags -
Little Johnny and Larry should team up
General Chit Chat: 8 hours ago, 5 flags -
Shane Gillis commercial
Jokes, Puns, & Pranks: 14 hours ago, 4 flags -
Will Us use alien technology to fight in ww3?
World War Three: 8 hours ago, 1 flags -
Nigel Farage now the Most Favoured UK Politician
Regional Politics: 1 hours ago, 1 flags -
Results of the use of the Oreshnik missile system in Dnepropetrovsk
World War Three: 14 minutes ago, 0 flags
active topics
-
Results of the use of the Oreshnik missile system in Dnepropetrovsk
World War Three • 1 • : gortex -
Nigel Farage now the Most Favoured UK Politician
Regional Politics • 3 • : gortex -
Well we know Putins ICBMs won't fail in their silos
World War Three • 179 • : andy06shake -
Will Us use alien technology to fight in ww3?
World War Three • 10 • : andy06shake -
Why isn't Psychiatry involved?
Social Issues and Civil Unrest • 13 • : ADVISOR -
WATCH LIVE: US Congress hearing on UFOs, unidentified anomalous phenomena
Aliens and UFOs • 152 • : Lazy88 -
Biden's "Reckless" Decision To Escalate Russia-Ukraine War
World War Three • 123 • : BedevereTheWise -
Elon Says It’s ‘Likely’ He Buys Tanking MSNBC
Political Ideology • 74 • : andy06shake -
Montelukast affects brain, caused 5 year old to attempt suicide
Medical Issues & Conspiracies • 10 • : DeadlyStaringFrog -
Jaguar Rebrand Video Causes "WTF?" Moment - Seriously Weird
Automotive Discussion • 21 • : Athetos
