It looks like you're using an Ad Blocker.
Please white-list or disable AboveTopSecret.com in your ad-blocking tool.
Thank you.
Some features of ATS will be disabled while you continue to use an ad-blocker.
8
share:
Voter Registration Changes: Nov 2020 to Jul 2024
Read a Gallup Poll story first time in decades the majority DOES NOT identify as Democrat, looking for the link and seeing if these numbers are legit.
If true we have seen a seismic shift politically in the US, it isn't necessarily Republican but it damn sure isn't Democrat either, We could see more viable Independent candidates in the future.
x.com...
x.com...
Read a Gallup Poll story first time in decades the majority DOES NOT identify as Democrat, looking for the link and seeing if these numbers are legit.
If true we have seen a seismic shift politically in the US, it isn't necessarily Republican but it damn sure isn't Democrat either, We could see more viable Independent candidates in the future.
x.com...
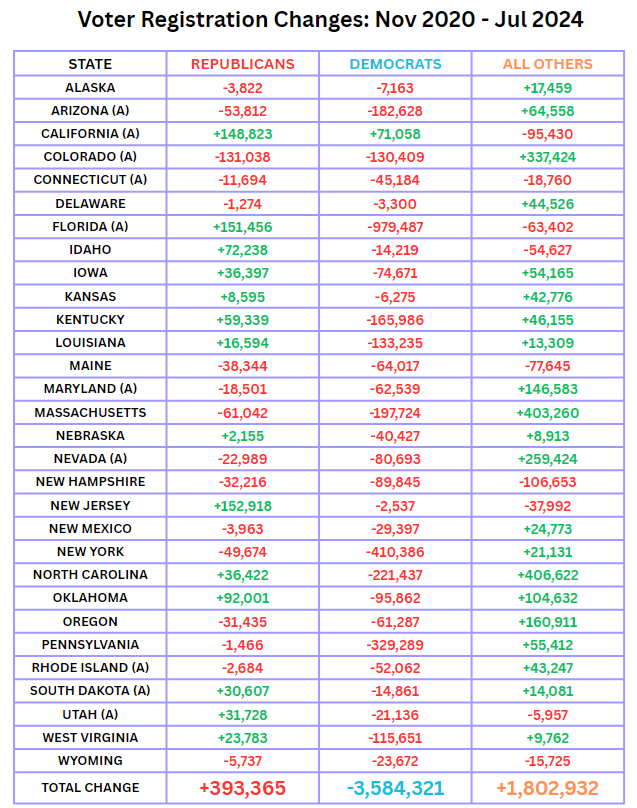
Voter Registration Changes: Nov 2020 to Jul 2024
KanekoaTheGreat
@KanekoaTheGreat
Voter Registration Changes: Nov 2020 to Jul 2024
🔴 Republicans: +393,365
🔵 Democrats: -3,584,321
⚪️ Independents: +1,802,932
x.com...
UngaTheGreat
@UngaTheGreat
Gallup: GOP Overtakes Democrats in Voter Identification for First Time
A Gallup poll shows:
➡️ More Americans now lean Republican over Democrat, with 48% siding with the GOP compared to 45% with Democrats.
➡️ Voters trust Republicans more on key issues like the economy and immigration, seeing them as better at safeguarding prosperity and security.
➡️ Just 22% are satisfied with the country's direction, and President Biden's approval rating has sunk to 39%.
➡️ The economic index also paints a grim picture, highlighting widespread pessimism and poor conditions.
@Gallup

edit on p000000309am096 by putnam6 because: (no reason given)
originally posted by: WeMustCare
a reply to: putnam6
The "normal" Republican Party wants to dump MAGA. That would make MAGA "independents", would it not?
Perhaps in the future, but as the RINO's influence wanes, for now, they both need each other, or we get 4 years of

Thought about posting this.
Conclusions:
Democrat "brand’ is now toxic.
People disgusted with democrats so call them selves independent. Every Facebook lizard boy calls himself "libertarian" - we are laughing out asses off with memes over that one…
The young generation are refusing to call themselves Democrat.
Conclusions:
Democrat "brand’ is now toxic.
People disgusted with democrats so call them selves independent. Every Facebook lizard boy calls himself "libertarian" - we are laughing out asses off with memes over that one…
The young generation are refusing to call themselves Democrat.
a reply to: putnam6
That's such a creepy pic of Walz; it looks like he's sniffing KH's hair..
A total of 2,196,365 voters were added to the Rep. and 'all other' rolls, while Dems lost 3,584,321 voters. That's a tiny drop of water in a big pond of 162.42 million registered voters. 1,348,024 are no longer listed as registered voters-so voter roll cleanup?
49.1% of registered voters are between the age of 18-24 while 46% are in the 35-49 year age group. Campaigning on a 'free perks for votes' works well for our youth and they're more likely to get out and vote than other groups.
The graph looked so promising until I broke it down. For example, of the 22 million registered voters in Californis 46% are Democrat with 25% being Republican. I'm not seeing any statistcal significance.
Our youth are all for a socalistic administration while other age groups have become more apathetic to voting for what they perceive as lame duck candidates or have the defeatist attitude of 'why bother voting; the Dems are going to cheat another win anyway'.
Either way, I think the election results are going to make the riots of the 60's look like childs' play.
originally posted by: WeMustCare
a reply to: putnam6
The "normal" Republican Party wants to dump MAGA. That would make MAGA "independents", would it not?
I think MAGAs have taken the (I) !! 😃 ⚖️🚬
We can assume the ultra RINOs are selling for Kamala because Kamala is a GoGo Girl for The NWO 😬


originally posted by: nugget1
a reply to: putnam6
That's such a creepy pic of Walz; it looks like he's sniffing KH's hair..
A total of 2,196,365 voters were added to the Rep. and 'all other' rolls, while Dems lost 3,584,321 voters. That's a tiny drop of water in a big pond of 162.42 million registered voters. 1,348,024 are no longer listed as registered voters-so voter roll cleanup?
True, if you think nationally instead of electorally, all will depend on where or what those independent voters do, if they sit out and voted Democrat in Pennsylvania that's a net plus for the GOP, if the numbers of the states were registration is tracked holds in the Rust Belt and the South it would seem to favor the Republicans, or thats my rationale
49.1% of registered voters are between the age of 18-24 while 46% are in the 35-49 year age group. Campaigning on a 'free perks for votes' works well for our youth and they're more likely to get out and vote than other groups.
We will see but I know plenty of Boomers who feel like this is our last hurrah, they are motivated to vote like never before. As for the youth there is a certain segment that's completely apathetic to both parties again it depends on where and how many ae motivated.
The graph looked so promising until I broke it down. For example, of the 22 million registered voters in Californis 46% are Democrat with 25% being Republican. I'm not seeing any statistcal significance.
California isn't going red however what is significant is that the number is so large is likely to bleed over into neighboring states like Nevada and Arizona
Our youth are all for a socalistic administration while other age groups have become more apathetic to voting for what they perceive as lame duck candidates or have the defeatist attitude of 'why bother voting; the Dems are going to cheat another win anyway'.
Either way, I think the election results are going to make the riots of the 60's look like childs' play.
I don't think so Im think it will be a little bit like The Boy Who Cried Wolf, the general public has heard DJT is Hitler OMB and a threat to Democracy so much the last 8 years it carries no weight, and just enough are contrarian enough to either not vote at all or vote Trump or a 3rd Party.
We will see but it feels like something has shifted and it will take an October surprise to balance it out
a reply to: putnam6
Republicans outnumbered Democrat registrations in California in what universe?
This data set has some incredulous (kinda desperate) X crap going on with it.
I'll focus on my state because I know that's total BS.
www.sos.ca.gov...
This goes by eligible voters in the state during the election cycle.
Total increase in voters registered since 2020:
1,250,376
2024:
No preference - 21.88% = 273,583
Democrat - 46.19% = 577,548
Republican - 24.73% = 309,217
I don't know about the other states, but I do know there aren't many Republicans willingly moving here to give such an absurd increase. And the ones that do switch parties, do so as they move to Texas.
This source does overall percentage change.
www.ppic.org...
This says the share of Democrats as a percentage of the total has increased slightly more than Republicans.
So if you take total voters 20,921,513 (2020) to 22,171,899 (2024) and apply that to the rates, the increase favors democrats still. 9,477,309 democrats in 2020 vs 10,243,417 Democrats in 2024. Which is a net 766,108 Democrat increase to 476,215 for Republicans.
I don't trust this X person that doesn't cite the Gallup poll that uses VERY VERY off numbers to say something disingenuous about my state's voter registration trends.
All this does is build up a true belief Republican registration dominated the last 4 years in ALL 50 states and sets people up to be angry and disenfranchised by the reality that is far from true. It serves to sell the implausibility of a Democrat win.
Republicans outnumbered Democrat registrations in California in what universe?
This data set has some incredulous (kinda desperate) X crap going on with it.
I'll focus on my state because I know that's total BS.
www.sos.ca.gov...
123-DAY REPORT OF REGISTRATION
July 5, 2024, for the November 5, 2024, General Election
TRENDS
Since the last 123-Day Report of Registration for a General in a Presidential election year (July 3,
2020):
• The total voter registration in the state increased from 20,921,513 to 22,171,899.
• The percentage of eligible Californians who are registered to vote decreased from 83.49% to
82.43%.
• The percentage of voters who have no party preference decreased from 24.04% to 21.88%.
• The percentage of voters registered with a qualified political party increased from 74.86% to
76.93%.
• The percentage of voters registered with the Democratic Party decreased from 46.32% to 46.19%.
• The percentage of voters registered with the Republican Party increased from 23.99% to 24.73%.
This goes by eligible voters in the state during the election cycle.
Total increase in voters registered since 2020:
1,250,376
2024:
No preference - 21.88% = 273,583
Democrat - 46.19% = 577,548
Republican - 24.73% = 309,217
I don't know about the other states, but I do know there aren't many Republicans willingly moving here to give such an absurd increase. And the ones that do switch parties, do so as they move to Texas.
This source does overall percentage change.
www.ppic.org...
The share of registered voters who are Democrats (46.2%) has increased slightly since 2020 (45.3%), the year of the last presidential election. The share of Republicans (24.7%) has held steady (23.9% in 2020).
This says the share of Democrats as a percentage of the total has increased slightly more than Republicans.
So if you take total voters 20,921,513 (2020) to 22,171,899 (2024) and apply that to the rates, the increase favors democrats still. 9,477,309 democrats in 2020 vs 10,243,417 Democrats in 2024. Which is a net 766,108 Democrat increase to 476,215 for Republicans.
I don't trust this X person that doesn't cite the Gallup poll that uses VERY VERY off numbers to say something disingenuous about my state's voter registration trends.
All this does is build up a true belief Republican registration dominated the last 4 years in ALL 50 states and sets people up to be angry and disenfranchised by the reality that is far from true. It serves to sell the implausibility of a Democrat win.
edit on 27-9-2024 by
Degradation33 because: (no reason given)
a reply to: putnam6
If this is the case, you would think it would be reflected in other polls as well.
projects.fivethirtyeight.com...
www.economist.com...
However, I do realize that "confirmation bias" is a hot commodity this election.
Voter Changes Since 2020 🔴GOP plus 393,365 🔵DNC minus 3,584,321 ⚪️ IND plus 1,802,932
If this is the case, you would think it would be reflected in other polls as well.
projects.fivethirtyeight.com...
www.economist.com...
However, I do realize that "confirmation bias" is a hot commodity this election.
edit on 27-9-2024 by lilzazz because: (no reason
given)
a reply to: putnam6
And that is what scares me the most, especially since the fear mongering by our programmers is all about war with a possible infrastructure collapse and/or the next pandemic.
BAMN has their bases covered should voting irregularities fail them.
We will see but it feels like something has shifted and it will take an October surprise to balance it out
And that is what scares me the most, especially since the fear mongering by our programmers is all about war with a possible infrastructure collapse and/or the next pandemic.
BAMN has their bases covered should voting irregularities fail them.
originally posted by: Degradation33
a reply to: putnam6
Republicans outnumbered Democrat registrations in California in what universe?
This data set has some incredulous (kinda desperate) X crap going on with it.
I'll focus on my state because I know that's total BS.
www.sos.ca.gov...
123-DAY REPORT OF REGISTRATION
July 5, 2024, for the November 5, 2024, General Election
TRENDS
Since the last 123-Day Report of Registration for a General in a Presidential election year (July 3,
2020):
• The total voter registration in the state increased from 20,921,513 to 22,171,899.
• The percentage of eligible Californians who are registered to vote decreased from 83.49% to
82.43%.
• The percentage of voters who have no party preference decreased from 24.04% to 21.88%.
• The percentage of voters registered with a qualified political party increased from 74.86% to
76.93%.
• The percentage of voters registered with the Democratic Party decreased from 46.32% to 46.19%.
• The percentage of voters registered with the Republican Party increased from 23.99% to 24.73%.
Thats all the X.com thread is pointing out the changes in voter registration since 2020
This goes by eligible voters in the state during the election cycle.
Total increase in voters registered since 2020:
1,250,376
2024:
No preference - 21.88% = 273,583
Democrat - 46.19% = 577,548
Republican - 24.73% = 309,217
I don't know about the other states, but I do know there aren't many Republicans willingly moving here to give such an absurd increase. And the ones that do switch parties, do so as they move to Texas.
This source does overall percentage change.
www.ppic.org...
The share of registered voters who are Democrats (46.2%) has increased slightly since 2020 (45.3%), the year of the last presidential election. The share of Republicans (24.7%) has held steady (23.9% in 2020).
This says the share of Democrats as a percentage of the total has increased slightly more than Republicans.
So if you take total voters 20,921,513 (2020) to 22,171,899 (2024) and apply that to the rates, the increase favors democrats still. 9,477,309 democrats in 2020 vs 10,243,417 Democrats in 2024. Which is a net 766,108 Democrat increase to 476,215 for Republicans.
I don't trust this X person that doesn't cite the Gallup poll that uses VERY VERY off numbers to say something disingenuous about my state's voter registration trends.
All this does is build up a true belief Republican registration dominated the last 4 years in ALL 50 states and sets people up to be angry and disenfranchised by the reality that is far from true. It serves to sell the implausibility of a Democrat win.
Come on Degradation33 is my post that hard to follow? granted I was up all night watching hurricane stuff.
Neither the figures nor am I suggesting Cali is gonna flip red to blue, it's just the totals in the state that have changed their registration since 2020 ergo if they weren't REGISTERED TO VOTE in the Land of milk and Honey in 2020 they aren't represented in this little treatise, No more no less.
It isn't about how many domestically or internationally 'newly imported voters" the Golden State will have in 2024, it's simply the number changes of voters who were registered in 2020
You are infinitely more intelligent than me and I know you know better, hell you should know me better too, I don't buy into the fear and end-of-the-world political manipulation diatribe that seemingly hits home with the DNC's anxious and fearful voter base. Ive said so numerous times. Anything else is solely your interpretation or dare I say your paranoia.
And please D33 let's not pretend ATS has a huge footprint and has far-reaching implications and for transparency here are the totals for the source thread about the Gallup article

That's 15 million views worldwide, look at the likes and the reposts and bookmarks do those numbers make the DNC minions fearful?
explodingtopics.com...
X User Data (Top Stats)
There are over 550 million monthly users on X
Most X users (58%) are under 35 years old
X has a 2:1 split of males to females
Around 1 in 4 X users are American
The average user spends 34 minutes, and 48 seconds on X
86.8% of X users also use Instagram
Elon Musk is the most-followed person on X (over 150 million followers)
X User Statistics
As of 2023, there are approximately 556 million active monthly users on X.
The reach domestically isn't large enough and the retention of said information will be long forgotten by the vast majority of its viewers by the end of this weekend if not sooner, especially in the male and under 35 category
As I mentioned Im stoked we might be slowly moving towards where we can have a viable 3rd party option, instead of only choice A or choice B.
I appreciate your attempt to unspin my spin, however...
a reply to: putnam6
Then you're smarter than me on this one because I can't figure out how they arrived at these numbers. He cites this other guy that posts graphs and looks like he's a statistician.
But his numbers aren't even close in the state I checked. It calls the rest into question.
This is the source data I found for this X post:
drive.google.com...
Did he just make it up? How does he cite incomplete data sets as sources? He could look up the actual state data?. This is like sourcing a snotty little rich kid from Connecticut who likes making pretty colored excel spreadsheets.
His data extrapolation seems flawed. Is he basing this on difference vs. expected numbers under the 2020 percentage?
I found The voter registration changes between the last election and July of this year. And he got every number wrong in CA. Even the hypothetical difference between the 2020 and 2024 percentage.
I think this source is just doing and inputting whatever.
edit on 27-9-2024 by Degradation33 because: (no reason given)
originally posted by: lilzazz
a reply to: putnam6
Voter Changes Since 2020 🔴GOP plus 393,365 🔵DNC minus 3,584,321 ⚪️ IND plus 1,802,932
If this is the case, you would think it would be reflected in other polls as well.
projects.fivethirtyeight.com...
www.economist.com...
However, I do realize that "confirmation bias" is a hot commodity this election.
I don't think you even read my thoughts Ive highlighted in red my words that should have imparted my skepticism.
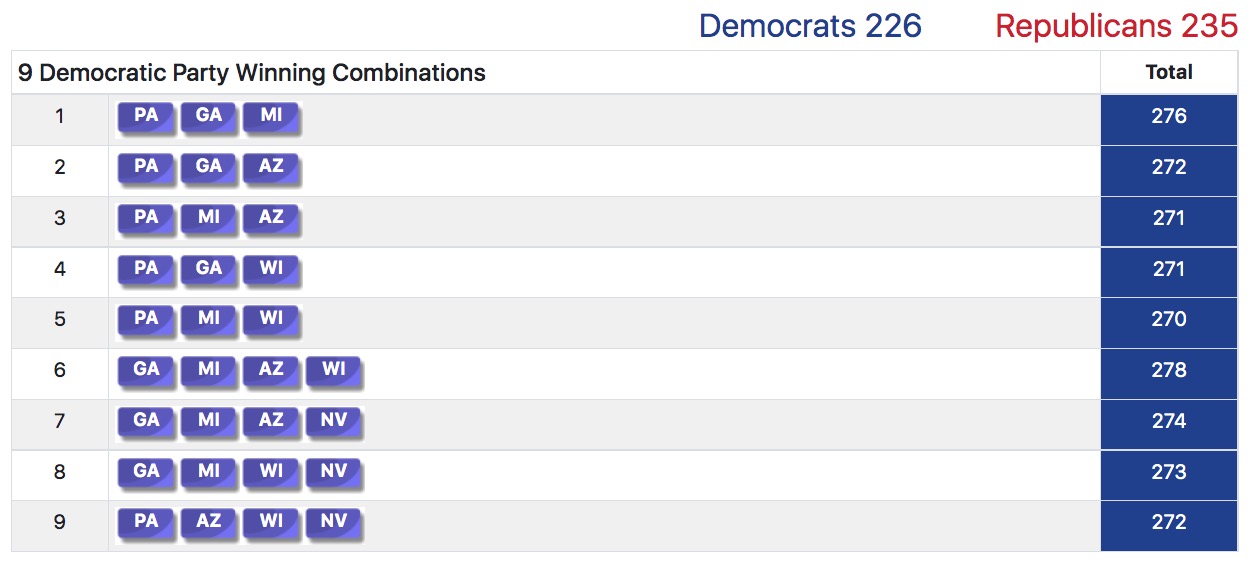
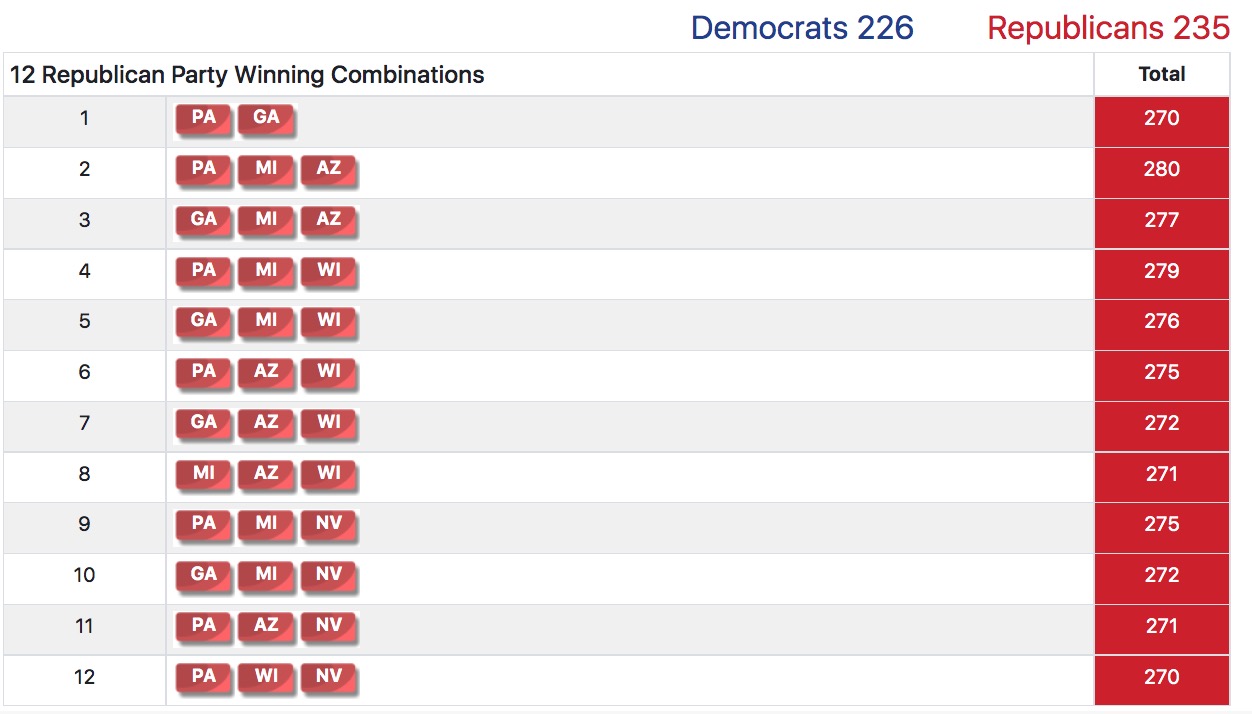
For the record and in my best Barrack Obama impression "Let me be clear" none of this has changed my thoughts that Trump has a one in three chance of being elected President again, and furthermore whoever wins Michigan, Wisconsin, and Pennsylvania will win and all three of those states are tossups or leaning towards Harris
Though ABCNews owns 538 aren't they currently being sued by Trump? I wonder if they have a confirmation bias.
My thoughts are based on the fact that Trump never was within 7 points of Biden in 2020 now whats the differnce in 538 polling in 2020 vs it's polling in 2024? It's so close if the totals hold in the solid color red or blue states in 2024 who will win will have to have one of the combinations below
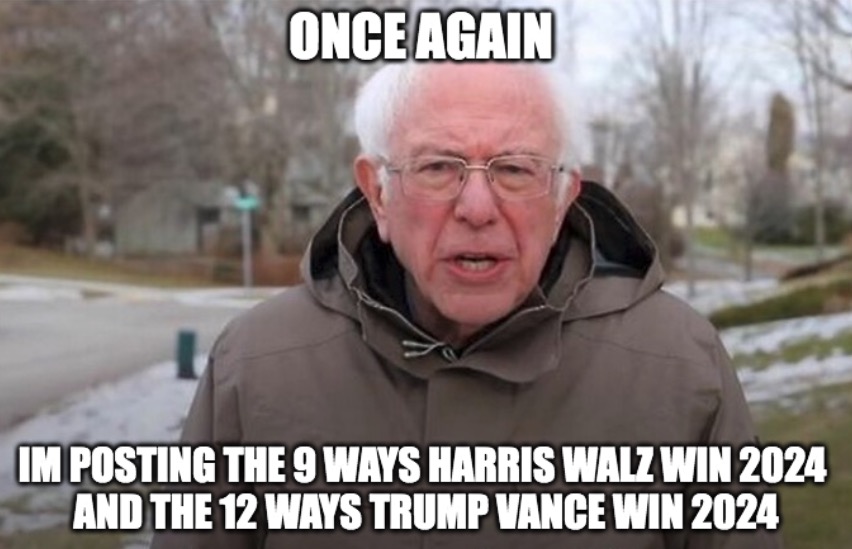
www.270towin.com...
Voter Registration Changes: Nov 2020 to Jul 2024
Read a Gallup Poll story first time in decades the majority DOES NOT identify as Democrat, looking for the link and seeing if these numbers are legit.
If truewe have seen a seismic shift politically in the US, it isn't necessarily Republican but it damn sure isn't Democrat either, We could see more viable Independent candidates in the future.
really hate fptp, making us act like this, spiraling towards conflict one step after another to claim victory over each other, all that awaits us on
this path is discontent, obstructionism, self sabotage, lawlessness, violence, extremism and tyranny.
trump is just the symptom of the destructive nature of fptp, if it was proportional instead of red state vs blue state all states would be purple, bipartisan, and willing to compromise to get things done once again because there would be no winner or loser, just more seats or less seats based of how many voted for each party.
got tired of these lying polls and stories years ago, because our current system doesn't truly represent us or serve our interests at all, it only serves the interests of capitalists and corporations.
edit on 27-9-2024 by namehere because: (no reason given)
This is just more evidence that Harris’ “joy” campaign isn’t working to get her folks out to the polls.
If they aren’t registering, they aren’t voting.
That’s how it’s supposed to work if it’s fair.
I don’t think there are unsolicited votes being mailed out this time.
Zero excitement from the Harris voters, over representation of democrats being polled, young people don’t like her, men like her even less than Hillary, blacks and hispanics have 20% less support for her than Biden, and the swing states continue to trend Trump.
She’s going to get beat by a significant margin and at this point it’s looking like she’ll lose the popular vote too fwiw.
Virginia is basically a toss up which is a surprise.
originally posted by: Degradation33
a reply to: putnam6
Then you're smarter than me on this one because I can't figure out how they arrived at these numbers. He cites this other guy that posts graphs and looks like he's a statistician.
But his numbers aren't even close in the state I checked. It calls the rest into question.
This is the source data I found for this X post:
drive.google.com...
Did he just make it up? How does he cite incomplete data sets as sources? He could look up the actual state data?. This is like sourcing a snotty little rich kid from Connecticut who likes making pretty colored excel spreadsheets.
His data extrapolation seems flawed. Is he basing this on difference vs. expected numbers under the 2020 percentage?
I found The voter registration changes between the last election and July of this year. And he got every number wrong in CA. Even the hypothetical difference between the 2020 and 2024 percentage.
I think this source is just doing and inputting whatever.
My original post had qualifiers like IF TRUE and IF these numbers are legit, FWIW
I didn't know I would have to immediately audit 28 states' voter registration figures and defend every one of them 6 hours later. All because I read a thread on X, I wish I hadn't posted the thread at all now
LOL, I don't have much of a life but if Im going to jump into this on a Friday afternoon I'll likely need a cup of coffee and an edible or 3.
I'll try and do some research one would think there would be citations elsewhere if the numbers were true.
but the Gallup article atleast seems legit, with the eternal caveat about how to lie with statistics
The real story here is that polls and statistics can't be trusted historically.
new topics
-
Can we be certain that Jesus Christ was born on December 25th?
Religion, Faith, And Theology: 2 hours ago -
RIP Merrily Harpur British Big Cat Realist
Cryptozoology: 4 hours ago -
Australian mercenary caught and crying as he is a prisoner of war.
Other Current Events: 9 hours ago -
JILL BIDEN Wants JOE to Punish Democrats Who Forced Him to Leave Office in Disgrace on 1.20.2025.
2024 Elections: 10 hours ago -
Panamanian President-“every square meter” of the Panama Canal belongs to Panama.
New World Order: 10 hours ago
top topics
-
The clotting is not going away latest
Medical Issues & Conspiracies: 16 hours ago, 10 flags -
NYPD arrests migrant who allegedly set woman on fire on subway train, watched her burn to death
Breaking Alternative News: 13 hours ago, 9 flags -
Panamanian President-“every square meter” of the Panama Canal belongs to Panama.
New World Order: 10 hours ago, 9 flags -
Australian mercenary caught and crying as he is a prisoner of war.
Other Current Events: 9 hours ago, 8 flags -
JILL BIDEN Wants JOE to Punish Democrats Who Forced Him to Leave Office in Disgrace on 1.20.2025.
2024 Elections: 10 hours ago, 7 flags -
RIP Merrily Harpur British Big Cat Realist
Cryptozoology: 4 hours ago, 3 flags -
Chef Gerald R. Ford
Food and Cooking: 16 hours ago, 2 flags -
Can we be certain that Jesus Christ was born on December 25th?
Religion, Faith, And Theology: 2 hours ago, 1 flags
active topics
-
Panamanian President-“every square meter” of the Panama Canal belongs to Panama.
New World Order • 11 • : xuenchen -
Can we be certain that Jesus Christ was born on December 25th?
Religion, Faith, And Theology • 7 • : Shoshanna -
Why isn't Psychiatry involved?
Social Issues and Civil Unrest • 32 • : Xtrozero -
‘Something horrible’: Somerset pit reveals bronze age cannibalism
Ancient & Lost Civilizations • 18 • : McGinty -
Post A Funny (T&C Friendly) Pic Part IV: The LOL awakens!
General Chit Chat • 7946 • : baddmove -
NYPD arrests migrant who allegedly set woman on fire on subway train, watched her burn to death
Breaking Alternative News • 15 • : Xtrozero -
Australian mercenary caught and crying as he is a prisoner of war.
Other Current Events • 10 • : Xtrozero -
The clotting is not going away latest
Medical Issues & Conspiracies • 14 • : mysterioustranger -
Research paper about plasmoids specifically calls out missing MH370 flight
General Conspiracies • 5 • : Skinnerbot -
The Cost of True Discipleship—Count the Cost
Religion, Faith, And Theology • 7 • : TheGoodNews
8
